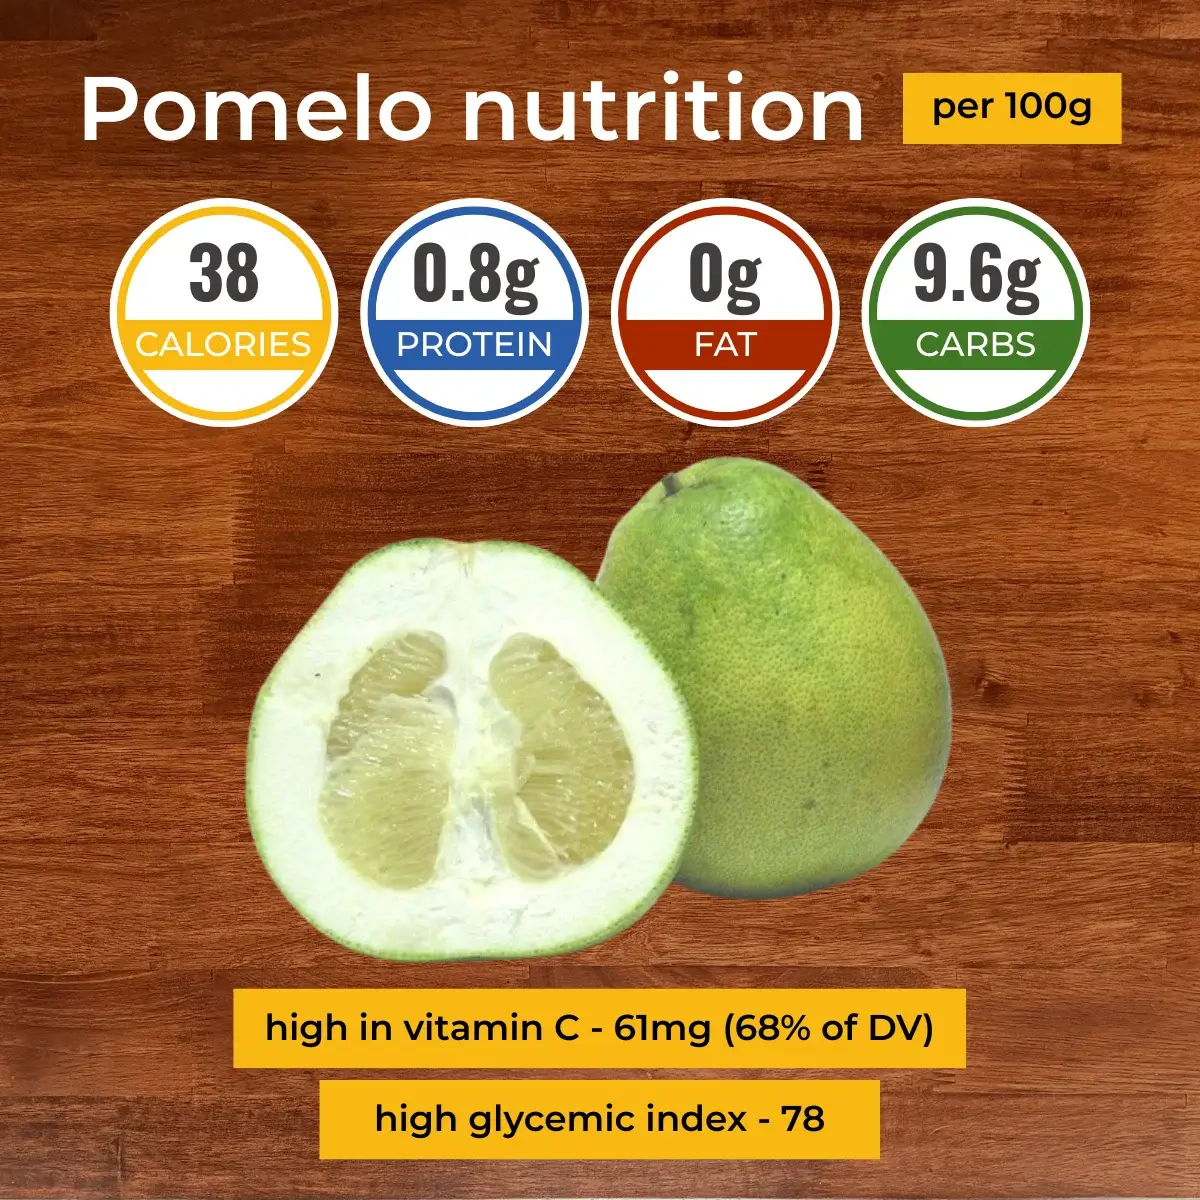
Pomelo nutrition: calories, carbs, GI, protein, fiber, fats

Carbs in Pomelo
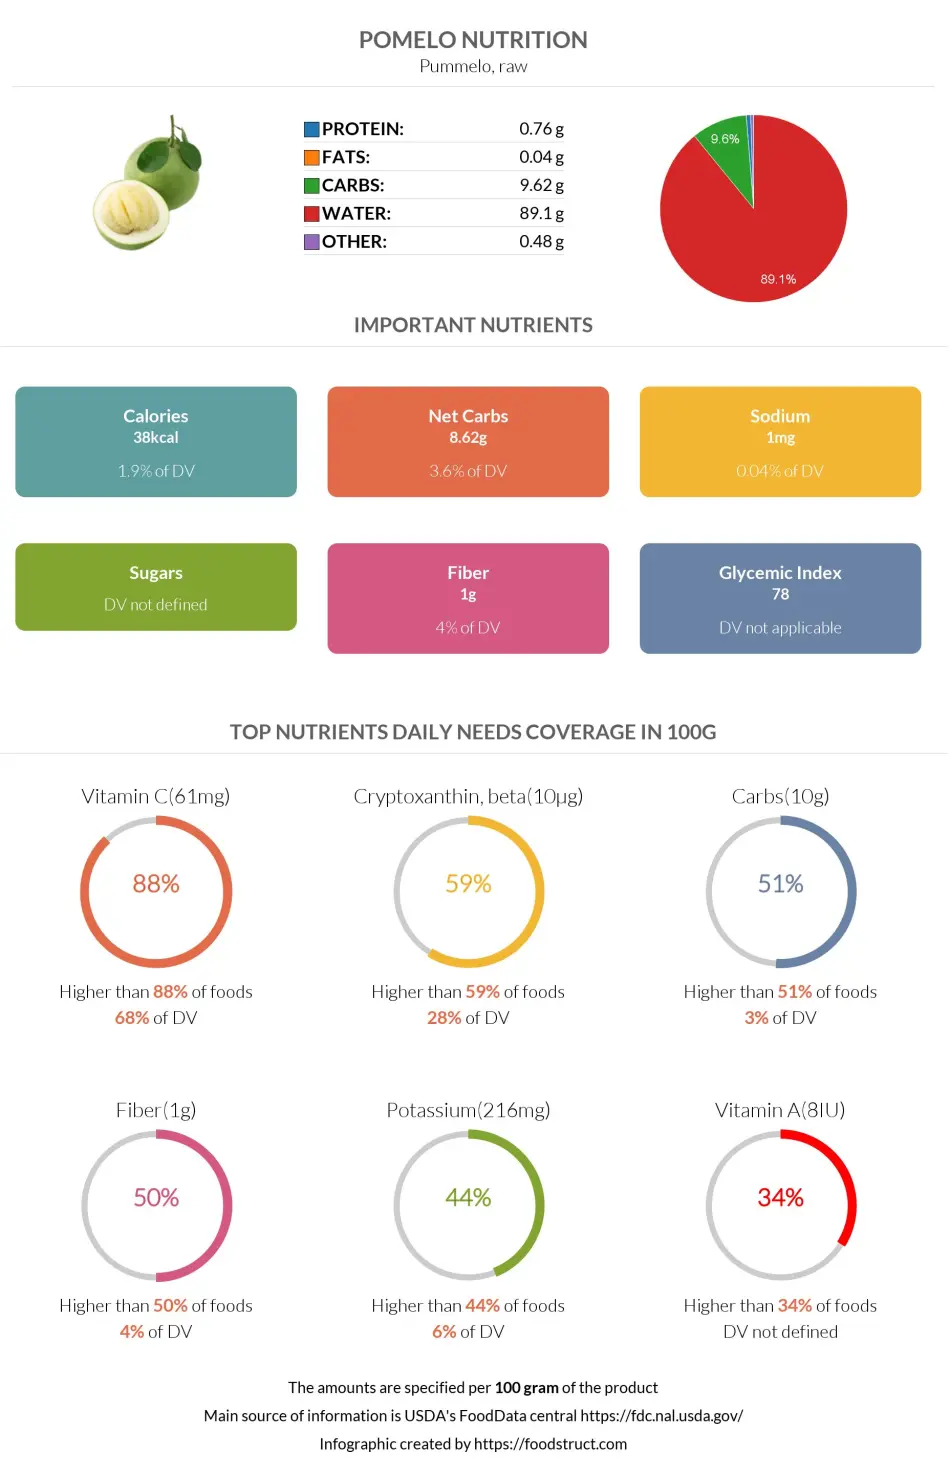
Pomelo is 89% water and 11% nutrients, primarily carbs. One hundred grams of pomelo contains 9.62g of carbs, which covers 3% of the daily need (in the case of a 2000-calorie diet).
Carbs per serving size
The average serving size of pomelo is one cup, sections (190g). One cup of pomelo contains 18.3g of carbs.
One pomelo, weighing 609g, contains 58.6g of carbs.
Carbohydrate Type Breakdown
One hundred grams of pomelo contains 9.62g of carbs, 1g of which is dietary fiber, and 8.62g are net carbs.
Pomelo net carbs
Almost 90% (8.96g) of pomelo carbs are net carbs, whereas the remaining 10% (1g) is dietary fiber. As one serving of pomelo is high in carbs, it is not considered a keto-friendly fruit.
Soluble or insoluble fiber
Pomelo is a good source of insoluble dietary fiber. According to one study, approximately 83% of the pomelo fruitlets fiber is insoluble (1).
Fiber content ratio for Pomelo
Pomelo Calories
Calories per 100g
Pomelo is a low-calorie fruit. One hundred grams of pomelo provides 38 calories, predominantly by carbs.
Macronutrients chart
Calories per serving size
One cup of pomelo, weighing 190g, provides 72.2 calories.
One fruit, weighing 609g, provides 231 calories.
Comparison
Compared to all foods in our database, pomelo is in the top 9% of foods low in calories.
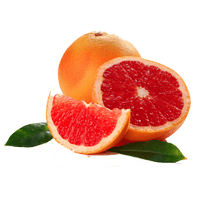
Pomelo is often being compared to grapefruit. Both fruits have very similar nutritional contents, grapefruit being slightly richer in carbs.
| Food | Calories, per serving | Calories, per 100g |
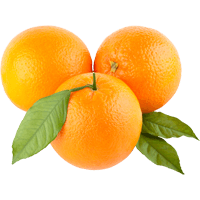
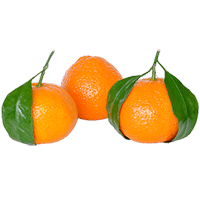
| Mandarin orange | 57.8 (1 NLEA, 109g) | 53 |
| Orange | 61.6 (1 fruit, 131g) | 47 |
| Grapefruit | 64.7 (1 NLEA, 154g) | 42 |
| Pomelo | 72.2 (1 cup, 190g) | 38 |
Summary table & burning estimates
We have calculated the duration and number of calories a person will burn by performing a certain type of activity, measured by a method called Met or Metabolic Equivalent of a Task (2, 3).
The table below shows the time and type of activity a person should perform to burn 72.2 calories from one cup of pomelo.
| 60kg person | 80kg person | 100kg person | |
| Walking | 21 min | 15.5 | 12.5 min |
| Running | 7 min | 5 min | 4 min |
| Bicycling | 10 min | 7.5 min | 6 min |
| Aerobics | 10 min | 7.5 min | 6 min |
Pomelo glycemic index
Pomelo, otherwise known as pummelo or Citrus maxima, is the largest natural citrus fruit. It is closely related to and is the ancestor of grapefruits.
One study has calculated the glycemic index of a Majia pomelo to fall in the range of 78.34±1.88 for healthy individuals and 72.15±1.95 for patients with type 2 diabetes (4). This puts pomelo in the high glycemic index category. However, pomelo has a low glycemic load, meaning pomelo consumption does not cause a significant glucose fluctuation in the blood.
Despite the high glycemic index, the intake of pomelo segments with bread has demonstrated a lower glycemic response when compared to bread alone. This is most likely due to the compound found in pomelo, named naringin, that has the ability to inhibit carbohydrate breakdown enzymes (5).
Research on mice has found pomelo peel extract to have the potential to prevent high-fat diet-induced metabolic disorders, such as type 2 diabetes and heart disease (6).
Overall, regardless of pomelo’s high glycemic index, it can be recommended, in limitation, to people with diabetes.
References
- https://pubmed.ncbi.nlm.nih.gov/33183633/
- https://www.ncbi.nlm.nih.gov/pmc/articles/PMC4428382/
- 2011 Compendium of Physical Activities
- https://pubmed.ncbi.nlm.nih.gov/29058284/
- https://europepmc.org/article/med/28764092
- https://www.ncbi.nlm.nih.gov/pmc/articles/PMC3797771/

Top nutrition facts for Pomelo
| Calories ⓘ Calories for selected serving | 38 kcal |
|
Glycemic index ⓘ
Source: https://pubmed.ncbi.nlm.nih.gov/29058284/
Check out our Glycemic index chart page for the full list.
|
78 (high) |
| Glycemic load ⓘ Glycemic Load (GL) is a metric that measures both the quality (Glycemic Index) and quantity of carbohydrates in a specific serving of food to estimate its impact on blood sugar levels. It is calculated as: (GI × Carbs in grams) / 100. | 13 (medium) |
| Net carbs ⓘ Net Carbs = Total Carbohydrates – Fiber – Sugar Alcohols | 9 g |
| Default serving size ⓘ Serving sizes are mostly taken from FDA's Reference Amounts Customarily Consumed (RACCs) | 1 cup, sections (190 g) |
| Acidity (Based on PRAL) ⓘ PRAL (Potential renal acid load) is calculated using a formula. On the PRAL scale the higher the positive value, the more is the acidifying effect on the body. The lower the negative value, the higher the alkalinity of the food. 0 is neutral. | -3.7 (alkaline) |
| Oxalates | 0 mg ⓘ https://www.sciencedirect.com/science/article/abs/pii/S0889157513000902 |
Pomelo calories (kcal)
| Calories for different serving sizes of pomelo | Calories | Weight |
|---|---|---|
| Calories in 100 grams | 38 | |
| Calories in 1 cup, sections | 72 | 190 g |
| Calories in 1 fruit without refuse | 231 | 609 g |
Extra Nutrition facts for Pomelo
| Protein per 100 calories ⓘ Shows how many grams of protein you get from 100 calories of this food, calculated as (protein in g ÷ calories) × 100. | 2 g |
| Calories per 10 g protein ⓘ Shows how many calories you need to eat from this food to get 10 g of protein, calculated as (calories ÷ protein in g) × 10. | 500 kcal |
| Weight per 100 calories ⓘ Shows how many grams of this food equal 100 kcal—higher grams mean a larger portion for the same calories. | 263 g |
Pomelo Glycemic index (GI)
Pomelo Glycemic load (GL)
Mineral coverage chart
Mineral chart - relative view
Vitamin coverage chart
Vitamin chart - relative view
All nutrients for Pomelo per 100g
| Nutrient | Value | DV% | In TOP % of foods | Comparison |
| Vitamin A | 0µg | 0% | 100% | |
| Calories | 38kcal | 2% | 92% |
1.2 times less than Orange
|
| Protein per 100 calories | 2g | N/A | 72% | |
| Calories per 10 g protein | 500kcal | N/A | 25% | |
| Weight per 100 calories | 263g | N/A | 9% | |
| Protein | 0.76g | 2% | 88% |
3.7 times less than Broccoli
|
| Fats | 0.04g | 0% | 96% |
832.8 times less than Cheese
|
| Vitamin C | 61mg | 68% | 3% |
1.2 times more than Lemon
|
| Net carbs | 8.6g | N/A | 49% |
6.3 times less than Chocolate
|
| Carbs | 9.6g | 3% | 50% |
2.9 times less than Rice
|
| Cholesterol | 0mg | 0% | 100% |
N/A
|
| Magnesium | 6mg | 1% | 82% |
23.3 times less than Almonds
|
| Calcium | 4mg | 0% | 90% |
31.3 times less than Milk
|
| Potassium | 216mg | 6% | 51% |
1.5 times more than Cucumber
|
| Iron | 0.11mg | 1% | 91% |
23.6 times less than Beef broiled
|
| Fiber | 1g | 4% | 44% |
2.4 times less than Orange
|
| Copper | 0.05mg | 5% | 67% |
3 times less than Shiitake
|
| Zinc | 0.08mg | 1% | 84% |
78.9 times less than Beef broiled
|
| Phosphorus | 17mg | 2% | 83% |
10.7 times less than Chicken meat
|
| Sodium | 1mg | 0% | 97% |
490 times less than White bread
|
| Manganese | 0.02mg | 1% | 56% | |
| Vitamin B1 | 0.03mg | 3% | 73% |
7.8 times less than Pea raw
|
| Vitamin B2 | 0.03mg | 2% | 82% |
4.8 times less than Avocado
|
| Vitamin B3 | 0.22mg | 1% | 79% |
43.5 times less than Turkey meat
|
| Vitamin B6 | 0.04mg | 3% | 75% |
3.3 times less than Oats
|
| Vitamin B12 | 0µg | 0% | 100% |
N/A
|
| Trans fat | 0g | N/A | 100% |
N/A
|
Check out similar food or compare with current
NUTRITION FACTS LABEL
Serving Size ______________
Health checks
Pomelo nutrition infographic
References
All the values for which the sources are not specified explicitly are taken from FDA’s Food Central. The exact link to the food presented on this page can be found below.