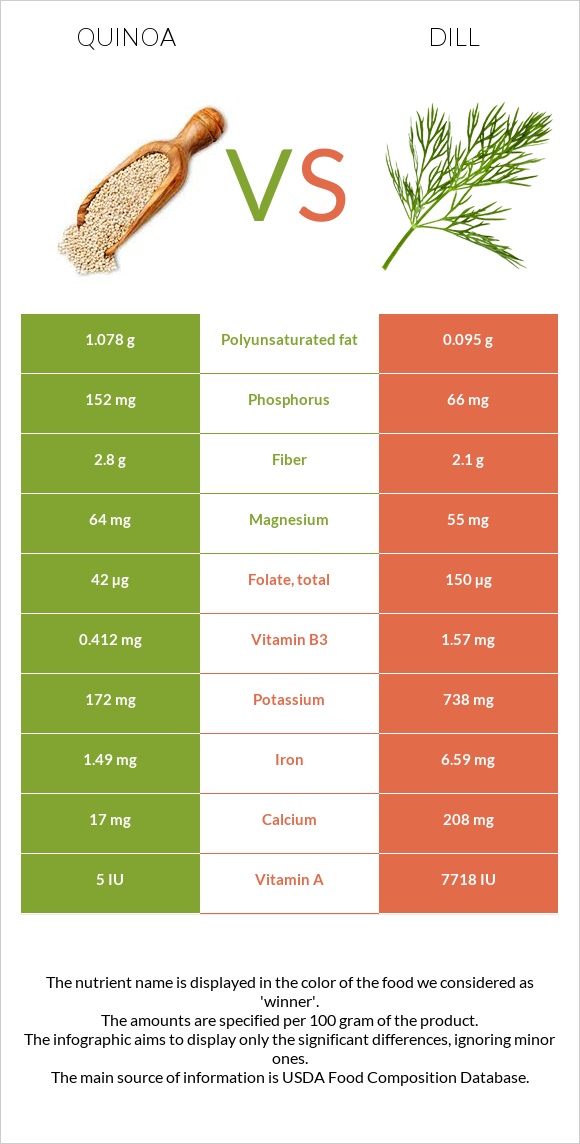
Important differences between quinoa and dill Quinoa has more phosphorus; however, dill has more vitamin A, vitamin C, iron, manganese, folate, calcium, potassium, vitamin B2, and vitamin B3. Dill's daily need coverage for vitamin A is 154% more. Quinoa has 2 times more phosphorus than dill. Quinoa has 152mg of phosphorus, while dill has 66mg. Quinoa has a higher glycemic index than dill. The food varieties used in the comparison are Quinoa, cooked and Dill weed, fresh .
Infographic
Mineral Comparison
Mineral comparison score is based on the number of minerals by which one or the other food is richer. The "coverage" charts below show how much of the daily needs can be covered by 300 grams of the food.
6
100 g
300 g
1 cup - 185g
Magnesium
Magnesium
Calcium
Calcium
Potassium
Potassium
Iron
Iron
Copper
Copper
Zinc
Zinc
Phosphorus
Phosphorus
Sodium
Sodium
Manganese
Manganese
Selenium
Selenium
46%
5.1%
15%
56%
64%
30%
65%
0.91%
82%
15%
4
100 g
300 g
5 sprigs - 1g 1 cup sprigs - 8.9g
Magnesium
Magnesium
Calcium
Calcium
Potassium
Potassium
Iron
Iron
Copper
Copper
Zinc
Zinc
Phosphorus
Phosphorus
Sodium
Sodium
Manganese
Manganese
Selenium
Selenium
39%
62%
65%
247%
49%
25%
28%
8%
165%
0%
Vitamin Comparison
Vitamin comparison score is based on the number of vitamins by which one or the other food is richer. The "coverage" charts below show how much of the daily needs can be covered by 300 grams of the food.
2
100 g
300 g
1 cup - 185g
Vitamin C
Vit. C
Vitamin D
Vit. D
Vitamin A
Vit. A
Vitamin E
Vit. E
Vitamin B1
Vit. B1
Vitamin B2
Vit. B2
Vitamin B3
Vit. B3
Vitamin B5
Vit. B5
Vitamin B6
Vit. B6
Vitamin B12
Vit. B12
Vitamin K
Vit. K
Folate
Folate
0%
0%
0%
13%
27%
25%
7.7%
0%
28%
0%
0%
32%
7
100 g
300 g
5 sprigs - 1g 1 cup sprigs - 8.9g
Vitamin C
Vit. C
Vitamin D
Vit. D
Vitamin A
Vit. A
Vitamin E
Vit. E
Vitamin B1
Vit. B1
Vitamin B2
Vit. B2
Vitamin B3
Vit. B3
Vitamin B5
Vit. B5
Vitamin B6
Vit. B6
Vitamin B12
Vit. B12
Vitamin K
Vit. K
Folate
Folate
283%
0%
129%
0%
15%
68%
29%
24%
43%
0%
0%
113%
All nutrients comparison - raw data values
Nutrient
DV% diff.
Vitamin C
0mg
85mg
94%
Iron
1.49mg
6.59mg
64%
Vitamin A
0µg
386µg
43%
Manganese
0.631mg
1.264mg
28%
Folate
42µg
150µg
27%
Calcium
17mg
208mg
19%
Potassium
172mg
738mg
17%
Vitamin B2
0.11mg
0.296mg
14%
Phosphorus
152mg
66mg
12%
Vitamin B5
0.397mg
8%
Starch
17.63g
7%
Vitamin B3
0.412mg
1.57mg
7%
Polyunsaturated fat
1.078g
0.095g
7%
Carbs
21.3g
7.02g
5%
Copper
0.192mg
0.146mg
5%
Selenium
2.8µg
5%
Vitamin B6
0.123mg
0.185mg
5%
Calories
120kcal
43kcal
4%
Vitamin E
0.63mg
4%
Vitamin B1
0.107mg
0.058mg
4%
Choline
23mg
4%
Fiber
2.8g
2.1g
3%
Protein
4.4g
3.46g
2%
Magnesium
64mg
55mg
2%
Zinc
1.09mg
0.91mg
2%
Sodium
7mg
61mg
2%
Fats
1.92g
1.12g
1%
Saturated fat
0.231g
0.06g
1%
Monounsaturated fat
0.528g
0.802g
1%
Protein per 100 calories
3.7g
8g
N/A
Calories per 10 g protein
273kcal
124kcal
N/A
Weight per 100 calories
83g
233g
N/A
Net carbs
18.5g
4.92g
N/A
Sugar
0.87g
N/A
Tryptophan
0.052mg
0.014mg
0%
Threonine
0.131mg
0.068mg
0%
Isoleucine
0.157mg
0.195mg
0%
Leucine
0.261mg
0.159mg
0%
Lysine
0.239mg
0.246mg
0%
Methionine
0.096mg
0.011mg
0%
Phenylalanine
0.185mg
0.065mg
0%
Valine
0.185mg
0.154mg
0%
Histidine
0.127mg
0.071mg
0%
Omega-3 - DHA
0.015g
N/A
Macronutrient Comparison
Macronutrient breakdown side-by-side comparison
3
4%
2%
21%
72%
Protein:
4.4 g
Fats:
1.92 g
Carbs:
21.3 g
Water:
71.61 g
Other:
0.77 g
2
3%
7%
86%
2%
Protein:
3.46 g
Fats:
1.12 g
Carbs:
7.02 g
Water:
85.95 g
Other:
2.45 g
Contains
more
Protein Protein
+27.2%
Contains
more
Fats Fats
+71.4%
Contains
more
Carbs Carbs
+203.4%
Contains
more
Water Water
+20%
Contains
more
Other Other
+218.2%
Fat Type Comparison
Fat type breakdown side-by-side comparison
1
13%
29%
59%
Saturated fat:
Sat. Fat
0.231 g
Monounsaturated fat:
Mono. Fat
0.528 g
Polyunsaturated fat:
Poly. Fat
1.078 g
2
6%
84%
10%
Saturated fat:
Sat. Fat
0.06 g
Monounsaturated fat:
Mono. Fat
0.802 g
Polyunsaturated fat:
Poly. Fat
0.095 g
Contains
more
Poly. Fat Polyunsaturated fat
+1034.7%
Contains
less
Sat. Fat Saturated fat
-74%
Contains
more
Mono. Fat Monounsaturated fat
+51.9%