Brown rice nutrition: calories, carbs, GI, protein, fiber, fats
Carbs in Brown Rice
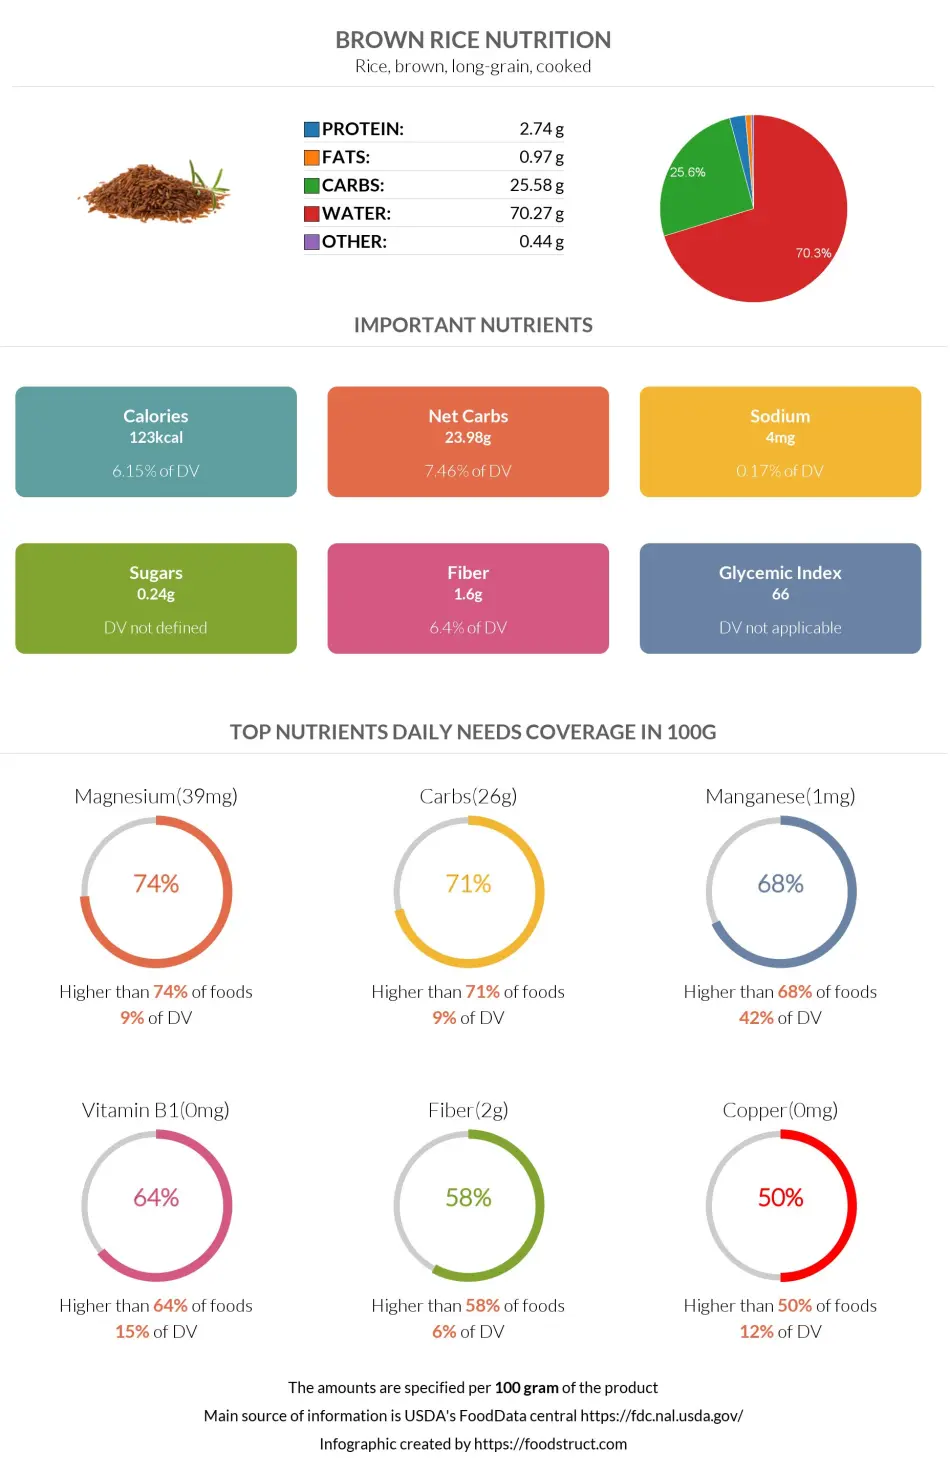
If we take cooked brown rice, we will notice it has a lot of water. But if we take the water out, it primarily consists of carbs. Long-grain cooked brown rice has 26 grams of carbs, 9% percent of the daily need (in the case of a 2000-calorie diet).
So, if you were on an uninhabited island with only brown rice, you would need to consume 1.1 kilograms of it to satisfy your daily needs.
Macronutrients chart
Carbs per serving size
The serving size of brown rice is usually around 200 grams, which results in 52 grams of carbs.
Carbs of different types
Carbohydrates in different types of brown rice can vary. It is caused by lower water content, but you are hardly interested in the number of carbs in raw rice as you probably will not eat it.
| Carbs per 100g | |
| Medium-grain brown rice | 23.5g |
| Uncooked brown rice | 76g |
| Long-grain raw brown rice | 76.25g |
Carbohydrate type breakdown
As you can see from the chart below, almost all of the carbs of brown rice are starch. The amount of sucrose is 0.24 grams, so small that it can be neglected.
Carbohydrate type breakdown
Brown rice net carbs
One of the main properties that differentiate brown rice from a more ordinary one is that it is not processed, and the fiber is not removed from it—so brown rice results in more fiber and, therefore, less net carbs.
From 26 grams of carbs in brown rice, 2 grams are fiber, which results in 24 grams of net carbs per 100 grams. It’s still too much to use frequently on low-carb diets like Keto, but it’s better than white rice.
You can check out our Brown rice vs. White rice article for more information about their differences.
Soluble or insoluble fiber
As for the type of fiber, a study (1) has shown that most fiber in rice bran is insoluble, which allows us to apply the same to brown rice as most of the fiber of brown rice comes from the rice bran.
According to another study, 1 cup of cooked brown rice has 3.5g of fiber, of which 0.39g is soluble fiber (2).
Fiber content ratio for Brown rice
Brown Rice Calories
Calories per 100g
A 100-gram of brown rice provides 123 calories. The main part of these calories comes from the carb content of brown rice.
Calories per Serving Size
One average serving size of brown rice is about 202 grams, which contains 249 calories.
Burning Estimates
The table below shows the time and type of activity a person should perform to burn 249 calories (one serving of brown rice) measured by a method called Met or Metabolic Equivalent of a Task (3, 4).
| 70kg person | 100kg person | |
| Walking | 53 min | 38 min |
| Cycling | 36 min | 15 min |
| Running | 20 min | 15 min |
| Aerobics | 42 min | 30 min |
Sources
- https://ift.onlinelibrary.wiley.com/doi/full/10.1111/j.1541-4337.2009.00099.x
- https://sci.washington.edu/info/forums/reports/FiberFacts.pdf
- https://dergipark.org.tr/tr/download/article-file/3047447
- https://www.researchgate.net/publication/279199271

Top nutrition facts for Brown rice
| Calories ⓘ Calories for selected serving | 123 kcal |
|
Glycemic index ⓘ
Source:
Check out our Glycemic index chart page for the full list.
|
66 (medium) |
| Glycemic load ⓘ Glycemic Load (GL) is a metric that measures both the quality (Glycemic Index) and quantity of carbohydrates in a specific serving of food to estimate its impact on blood sugar levels. It is calculated as: (GI × Carbs in grams) / 100. | 32 (high) |
| Insulin index ⓘ The insulin index of foods demonstrates how much a food increases the insulin level in the blood, in the first two-hour period after consumption. | 62 ⓘ https://academic.oup.com/ajcn/article/66/5/1264/4655967 – 62 |
| Net carbs ⓘ Net Carbs = Total Carbohydrates – Fiber – Sugar Alcohols | 24 g |
| Default serving size ⓘ Serving sizes are mostly taken from FDA's Reference Amounts Customarily Consumed (RACCs) | 1 cup (202 g) |
| Acidity (Based on PRAL) ⓘ PRAL (Potential renal acid load) is calculated using a formula. On the PRAL scale the higher the positive value, the more is the acidifying effect on the body. The lower the negative value, the higher the alkalinity of the food. 0 is neutral. | 2.3 (acidic) |
| Oxalates | 13 mg ⓘ https://pubmed.ncbi.nlm.nih.gov/16608223/ |
Brown rice calories (kcal)
| Calories for different serving sizes of brown rice | Calories | Weight |
|---|---|---|
| Calories in 100 grams | 123 | |
| Calories in 1 cup | 248 | 202 g |
| Calories for different varieties of brown rice | Calories | Weight |
|---|---|---|
| Rice, brown, long-grain, cooked (this food) | 123 | 100 g |
| Rice, brown, medium-grain, cooked | 112 | 100 g |
| Rice, brown, parboiled, cooked, UNCLE BENS | 147 | 100 g |
| Rice, brown, medium-grain, raw | 362 | 100 g |
| Rice, brown, long-grain, raw | 367 | 100 g |
| Rice, brown, parboiled, dry, UNCLE BEN'S | 370 | 100 g |
Extra Nutrition facts for Brown rice
| Protein per 100 calories ⓘ Shows how many grams of protein you get from 100 calories of this food, calculated as (protein in g ÷ calories) × 100. | 2.2 g |
| Calories per 10 g protein ⓘ Shows how many calories you need to eat from this food to get 10 g of protein, calculated as (calories ÷ protein in g) × 10. | 449 kcal |
| Weight per 100 calories ⓘ Shows how many grams of this food equal 100 kcal—higher grams mean a larger portion for the same calories. | 81 g |
Brown rice Glycemic index (GI)
Brown rice Glycemic load (GL)
Mineral coverage chart
Mineral chart - relative view
Vitamin coverage chart
Vitamin chart - relative view
Protein quality breakdown
Fat type information
All nutrients for Brown rice per 100g
| Nutrient | Value | DV% | In TOP % of foods | Comparison |
| Vitamin A | 0µg | 0% | 100% | |
| Calories | 123kcal | 6% | 68% |
2.6 times more than Orange
|
| Protein | 2.7g | 7% | 73% |
Equal to Broccoli
|
| Protein per 100 calories | 2.2g | N/A | 69% | |
| Calories per 10 g protein | 449kcal | N/A | 28% | |
| Weight per 100 calories | 81g | N/A | 33% | |
| Fats | 0.97g | 1% | 75% |
34.3 times less than Cheese
|
| Vitamin C | 0mg | 0% | 100% |
N/A
|
| Net carbs | 24g | N/A | 29% |
2.3 times less than Chocolate
|
| Carbs | 26g | 9% | 30% |
1.1 times less than Rice
|
| Cholesterol | 0mg | 0% | 100% |
N/A
|
| Vitamin D* | 0 IU | 0% | 100% |
N/A
|
| Vitamin D | 0µg | 0% | 100% |
N/A
|
| Magnesium | 39mg | 9% | 18% |
3.6 times less than Almonds
|
| Calcium | 3mg | 0% | 92% |
41.7 times less than Milk
|
| Potassium | 86mg | 3% | 81% |
1.7 times less than Cucumber
|
| Iron | 0.56mg | 7% | 74% |
4.6 times less than Beef broiled
|
| Sugar | 0.24g | N/A | 53% |
37.4 times less than Coca-Cola
|
| Fiber | 1.6g | 6% | 35% |
1.5 times less than Orange
|
| Copper | 0.11mg | 12% | 36% |
1.3 times less than Shiitake
|
| Zinc | 0.71mg | 6% | 53% |
8.9 times less than Beef broiled
|
| Starch | 25g | 10% | 4% |
1.6 times more than Potato
|
| Phosphorus | 103mg | 15% | 57% |
1.8 times less than Chicken meat
|
| Sodium | 4mg | 0% | 92% |
122.5 times less than White bread
|
| Vitamin E | 0.17mg | 1% | 47% |
8.6 times less than Kiwi
|
| Manganese | 0.97mg | 42% | 8% | |
| Selenium | 5.8µg | 11% | 47% | |
| Vitamin B1 | 0.18mg | 15% | 30% |
1.5 times less than Pea raw
|
| Vitamin B2 | 0.07mg | 5% | 69% |
1.9 times less than Avocado
|
| Vitamin B3 | 2.6mg | 16% | 47% |
3.7 times less than Turkey meat
|
| Vitamin B5 | 0.38mg | 8% | 42% |
3 times less than Sunflower seeds
|
| Vitamin B6 | 0.12mg | 9% | 50% |
Equal to Oats
|
| Vitamin B12 | 0µg | 0% | 100% |
N/A
|
| Vitamin K | 0.2µg | 0% | 45% |
508 times less than Broccoli
|
| Trans fat | 0g | N/A | 100% |
N/A
|
| Folate | 9µg | 2% | 51% |
6.8 times less than Brussels sprouts
|
| Choline | 9.2mg | 2% | 41% | |
| Saturated fat | 0.26g | 1% | 72% |
22.7 times less than Beef broiled
|
| Monounsaturated fat | 0.37g | N/A | 67% |
26.6 times less than Avocado
|
| Polyunsaturated fat | 0.37g | N/A | 61% |
128.9 times less than Walnut
|
| Tryptophan | 0.03mg | 0% | 48% |
9.2 times less than Chicken meat
|
| Threonine | 0.1mg | 0% | 49% |
7.6 times less than Beef broiled
|
| Isoleucine | 0.11mg | 0% | 49% |
8.4 times less than Salmon raw
|
| Leucine | 0.21mg | 0% | 48% |
11.4 times less than Tuna Bluefin
|
| Lysine | 0.1mg | 0% | 50% |
4.6 times less than Tofu
|
| Methionine | 0.06mg | 0% | 47% |
1.7 times less than Quinoa
|
| Phenylalanine | 0.13mg | 0% | 48% |
5 times less than Egg
|
| Valine | 0.15mg | 0% | 48% |
13.4 times less than Soybean raw
|
| Histidine | 0.07mg | 0% | 48% |
11.3 times less than Turkey meat
|
| Fructose | 0g | 0% | 100% |
N/A
|
| Caffeine | 0mg | 0% | 100% | |
| Omega-3 - EPA | 0g | N/A | 100% |
N/A
|
| Omega-3 - DHA | 0g | N/A | 100% |
N/A
|
| Omega-3 - ALA | 0.01g | N/A | 20% |
830.9 times less than Canola oil
|
| Omega-3 - DPA | 0g | N/A | 100% |
N/A
|
| Omega-3 - Eicosatrienoic acid | 0g | N/A | 100% | |
| Omega-6 - Gamma-linoleic acid | 0g | N/A | 100% | |
| Omega-6 - Dihomo-gamma-linoleic acid | 0g | N/A | 100% | |
| Omega-6 - Eicosadienoic acid | 0g | N/A | 100% | |
| Omega-6 - Linoleic acid | 0.36g | N/A | 14% |
34.7 times less than Almonds
|
Check out similar food or compare with current
NUTRITION FACTS LABEL
Serving Size ______________
Health checks
Brown rice nutrition infographic
References
All the values for which the sources are not specified explicitly are taken from FDA’s Food Central. The exact link to the food presented on this page can be found below.