Roast beef sandwich vs. Veggie burger — In-Depth Nutrition Comparison
Compare
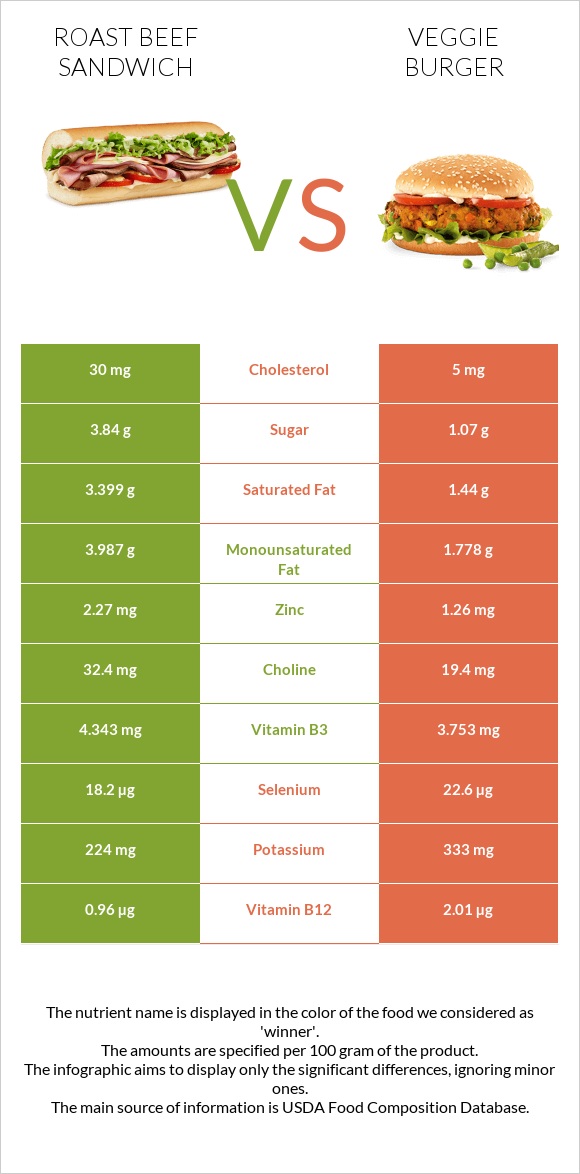
How are roast beef sandwich and veggie burgers different?
- Roast beef sandwich is richer in zinc, while veggie burgers are higher in vitamin B1, vitamin B12, manganese, folate, fiber, copper, and calcium.
- Veggie burgers cover your daily need for vitamin B1, 203% more than roast beef sandwich.
- Roast beef sandwich contains 6 times more cholesterol than veggie burgers. Roast beef sandwich contains 30mg of cholesterol, while veggie burgers contain 5mg.
Fast foods, roast beef sandwich, plain and Veggie burgers or soyburgers, unprepared types were used in this article.
Infographic
Infographic link
Mineral Comparison
Mineral comparison score is based on the number of minerals by which one or the other food is richer. The "coverage" charts below show how much of the daily needs can be covered by 300 grams of the food.
| Contains more ZincZinc | +80.2% |
| Contains more MagnesiumMagnesium | +143.5% |
| Contains more CalciumCalcium | +147.3% |
| Contains more PotassiumPotassium | +48.7% |
| Contains more CopperCopper | +83.5% |
| Contains less SodiumSodium | -12.9% |
| Contains more ManganeseManganese | +306.4% |
| Contains more SeleniumSelenium | +24.2% |
Vitamin Comparison
Vitamin comparison score is based on the number of vitamins by which one or the other food is richer. The "coverage" charts below show how much of the daily needs can be covered by 300 grams of the food.
| Contains more Vitamin AVitamin A | +100% |
| Contains more Vitamin EVitamin E | +87% |
| Contains more Vitamin B2Vitamin B2 | +17.6% |
| Contains more Vitamin B3Vitamin B3 | +15.7% |
| Contains more Vitamin CVitamin C | +∞% |
| Contains more Vitamin B1Vitamin B1 | +1121.7% |
| Contains more Vitamin B6Vitamin B6 | +40.9% |
| Contains more Vitamin B12Vitamin B12 | +109.4% |
| Contains more Vitamin KVitamin K | +50% |
| Contains more FolateFolate | +143.1% |
All nutrients comparison - raw data values
| Nutrient |  |
 |
DV% diff. |
| Vitamin B1 | 0.217mg | 2.651mg | 203% |
| Vitamin B12 | 0.96µg | 2.01µg | 44% |
| Manganese | 0.234mg | 0.951mg | 31% |
| Folate | 51µg | 124µg | 18% |
| Fiber | 1.3g | 4.9g | 14% |
| Copper | 0.109mg | 0.2mg | 10% |
| Zinc | 2.27mg | 1.26mg | 9% |
| Saturated fat | 3.399g | 1.44g | 9% |
| Cholesterol | 30mg | 5mg | 8% |
| Magnesium | 23mg | 56mg | 8% |
| Calcium | 55mg | 136mg | 8% |
| Selenium | 18.2µg | 22.6µg | 8% |
| Vitamin B6 | 0.215mg | 0.303mg | 7% |
| Fats | 10.3g | 6.3g | 6% |
| Vitamin B5 | 0.289mg | 6% | |
| Monounsaturated fat | 3.987g | 1.778g | 6% |
| Vitamin C | 0mg | 4.5mg | 5% |
| Starch | 17.65g | 5.78g | 5% |
| Sodium | 653mg | 569mg | 4% |
| Vitamin B3 | 4.343mg | 3.753mg | 4% |
| Calories | 244kcal | 177kcal | 3% |
| Carbs | 22.21g | 14.27g | 3% |
| Potassium | 224mg | 333mg | 3% |
| Iron | 2.64mg | 2.41mg | 3% |
| Vitamin B2 | 0.287mg | 0.244mg | 3% |
| Choline | 32.4mg | 19.4mg | 2% |
| Polyunsaturated fat | 1.762g | 2.023g | 2% |
| Fructose | 1.5g | 0.13g | 2% |
| Protein | 15.17g | 15.7g | 1% |
| Phosphorus | 200mg | 206mg | 1% |
| Vitamin E | 0.43mg | 0.23mg | 1% |
| Vitamin K | 2.8µg | 4.2µg | 1% |
| Protein per 100 calories | 6.2g | 8.9g | N/A |
| Calories per 10 g protein | 161kcal | 113kcal | N/A |
| Weight per 100 calories | 41g | 56g | N/A |
| Unsaturated / Saturated Fat ratio | 1.7 | 2.6 | N/A |
| Net carbs | 20.91g | 9.37g | N/A |
| Vitamin D* | 1 IU | 0 IU | 0% |
| Sugar | 3.84g | 1.07g | N/A |
| Vitamin A | 2µg | 1µg | 0% |
| Trans fat | 0.389g | N/A | |
| Tryptophan | 0.162mg | 0% | |
| Threonine | 0.605mg | 0% | |
| Isoleucine | 0.78mg | 0% | |
| Leucine | 1.399mg | 0% | |
| Lysine | 1.004mg | 0% | |
| Methionine | 0.291mg | 0% | |
| Phenylalanine | 0.885mg | 0% | |
| Valine | 0.89mg | 0% | |
| Histidine | 0.465mg | 0% | |
| Omega-3 - EPA | 0.005g | 0g | N/A |
| Omega-3 - ALA | 0.152g | 0.081g | N/A |
| Omega-3 - DPA | 0.008g | 0g | N/A |
| Omega-6 - Gamma-linoleic acid | 0.007g | 0g | N/A |
| Omega-6 - Dihomo-gamma-linoleic acid | 0.01g | N/A | |
| Omega-6 - Eicosadienoic acid | 0.002g | 0g | N/A |
| Omega-6 - Linoleic acid | 1.465g | N/A |
Macronutrient Comparison
Macronutrient breakdown side-by-side comparison
Protein:
15.17 g
Fats:
10.3 g
Carbs:
22.21 g
Water:
49.91 g
Other:
2.41 g
Protein:
15.7 g
Fats:
6.3 g
Carbs:
14.27 g
Water:
61.21 g
Other:
2.52 g
| Contains more FatsFats | +63.5% |
| Contains more CarbsCarbs | +55.6% |
| Contains more WaterWater | +22.6% |
~equal in
Protein
~15.7g
~equal in
Other
~2.52g
Fat Type Comparison
Fat type breakdown side-by-side comparison
Saturated fat:
Sat. Fat
3.399 g
Monounsaturated fat:
Mono. Fat
3.987 g
Polyunsaturated fat:
Poly. Fat
1.762 g
Saturated fat:
Sat. Fat
1.44 g
Monounsaturated fat:
Mono. Fat
1.778 g
Polyunsaturated fat:
Poly. Fat
2.023 g
| Contains more Mono. FatMonounsaturated fat | +124.2% |
| Contains less Sat. FatSaturated fat | -57.6% |
| Contains more Poly. FatPolyunsaturated fat | +14.8% |
Carbohydrate type comparison
Carbohydrate type breakdown side-by-side comparison
Starch:
17.65 g
Sucrose:
0 g
Glucose:
1.34 g
Fructose:
1.5 g
Lactose:
0 g
Maltose:
1 g
Galactose:
0 g
Starch:
5.78 g
Sucrose:
0.62 g
Glucose:
0.26 g
Fructose:
0.13 g
Lactose:
0.06 g
Maltose:
0 g
Galactose:
0 g
| Contains more StarchStarch | +205.4% |
| Contains more GlucoseGlucose | +415.4% |
| Contains more FructoseFructose | +1053.8% |
| Contains more MaltoseMaltose | +∞% |
| Contains more SucroseSucrose | +∞% |
| Contains more LactoseLactose | +∞% |
~equal in
Galactose
~0g


