Rockfish vs. Cod — Health Impact and Nutrition Comparison


Summary
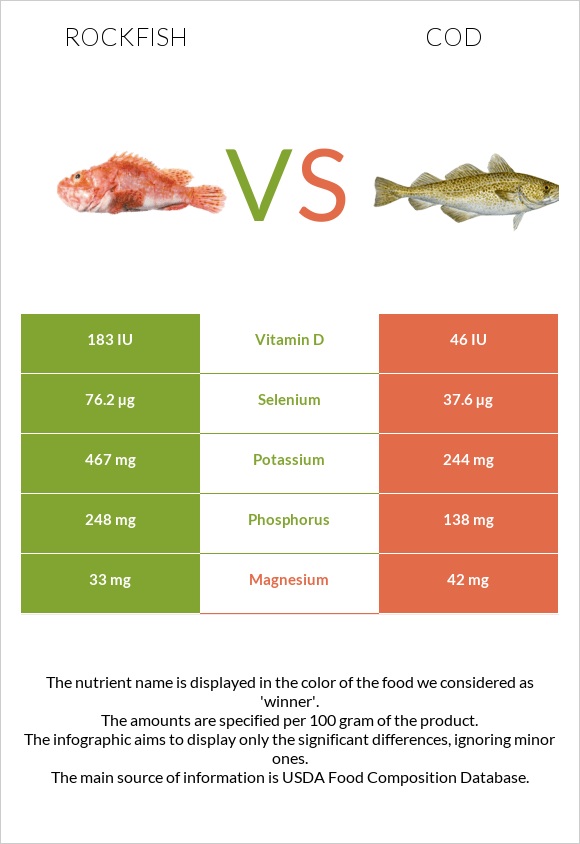
Cod is higher in selenium, A, E, C, and K vitamins, and calcium. Rockfish contains more cholesterol, vitamin D, and slightly higher calories. Cod provides less vitamin D than rockfish.
Introduction
Rockfish and cod are two of the most famous fishes known worldwide. They are excellent sources of white meat. In this article, we will compare these species, focusing on their nutritional profile and health impact, and discussing their actual differences.
Actual differences
Cod (1) is a common name for a demersal fish from the genus Gadus. It is usually consumed grilled, baked, deep-fried, or broiled. Cod has a mild, non-fishy, and a bit sweet taste. It is widespread in the Atlantic and Pacific areas. You can easily find cod in markets, fresh or frozen.
The most common cod types are Atlantic Cod (Scrod, Whitefish, Grey Cod), Pacific Cod (Alaska Cod, Codfish), Black Cod, Lingcod (Buffalo Cod, Bluefish, White Cod), Rockfish (Rock Cod, Pacific Snapper), and Pollock.
Rockfish (2) is a silverfish with a white belly. It is also known as the Atlantic striped bass. Rockfish has a buttery, non-fishy flavor. It is usually steamed, broiled, or roasted. The fish lives in the North Pacific and Bring sea.
The most common rockfish types are Canary Rockfish, Copper Rockfish, and Widow Rockfish.
Nutrition
In this part of the article, we will discuss the macronutrient, mineral, and vitamin composition of rockfish and cod. Both of them are nutritious fish without any amounts of carbs.
Macronutrient Comparison
Contains
more
FatsFats
+88.4%
Contains
more
OtherOther
+279.5%
Protein
Cod is slightly richer in protein than rockfish. Per 100g serving, cod provides 22.8g of protein, while rockfish contains 22.2g of it.
Both of them are good sources of essential amino acids.
Fat
Cod and rockfish do not provide significant amounts of fat per 100g.
Cod is 6mg lower in cholesterol than rockfish.
Fat Type Comparison
Contains
more
Mono. FatMonounsaturated fat
+275.8%
Contains
more
Poly. FatPolyunsaturated fat
+66.1%
Contains
less
Sat. FatSaturated fat
-60%
Calories
Rockfish provides slightly more calories than cod.
Minerals
Cod is packed with selenium. Also, it contains more zinc, magnesium, and iron.
Rockfish provides more phosphorus than cod. Rockfish is rich in mercury.
Mineral Comparison
Contains
more
CalciumCalcium
+21.4%
Contains
more
PotassiumPotassium
+91.4%
Contains
more
CopperCopper
+13.9%
Contains
more
PhosphorusPhosphorus
+79.7%
Contains
more
SeleniumSelenium
+102.7%
Contains
more
MagnesiumMagnesium
+27.3%
Contains
more
IronIron
+36.1%
Contains
more
ZincZinc
+34.9%
Contains
less
SodiumSodium
-12.4%
Contains
more
ManganeseManganese
+53.8%
Vitamins
Cod is richer in vitamins A, E, C, B1, K, and B6. Rockfish contains more vitamin D, B12, and folate.
Vitamin Comparison
Contains
more
Vitamin DVitamin D
+283.3%
Contains
more
Vitamin B2Vitamin B2
+186.1%
Contains
more
Vitamin B3Vitamin B3
+15.3%
Contains
more
Vitamin B5Vitamin B5
+124.4%
Contains
more
Vitamin B12Vitamin B12
+51.4%
Contains
more
FolateFolate
+25%
Contains
more
Vitamin CVitamin C
+∞%
Contains
more
Vitamin AVitamin A
+180%
Contains
more
Vitamin EVitamin E
+84.1%
Contains
more
Vitamin B1Vitamin B1
+225.9%
Contains
more
Vitamin B6Vitamin B6
+17.4%
Contains
more
Vitamin KVitamin K
+∞%
Glycemic index
Cod and rockfish have a glycemic index equaling 0. Check our glycemic index chart for more GI values.
Health impact
Cardiovascular health
Consuming cod and rockfish is associated with a lower risk of heart disease (3). This is due to the presence of omega-3 fatty acids. These are long-chain essential fatty acids that the human body cannot produce. Therefore, they should be included in the meals we eat.
Health risks
Rockfish is classified as food with moderate amounts of mercury. While this mineral is not harmful to healthy middle-aged persons, it can be toxic to youngsters, teenagers, and pregnant women (4). The easiest way to avoid mercury poisoning is to limit your fish intake. Since cod has a lower mercury content than rockfish, it is a better option for preventing mercury poisoning (5).
Cod can contain parasites if eaten uncooked without being cooked or frozen (6).
References
- https://fdc.nal.usda.gov/fdc-app.html#/food-details/171955/nutrients
- https://fdc.nal.usda.gov/fdc-app.html#/food-details/173684/nutrients
- https://www.ncbi.nlm.nih.gov/pmc/articles/PMC7468748/
- https://www.ncbi.nlm.nih.gov/pmc/articles/PMC2954077/
- https://www.fda.gov/food/metals-and-your-food/mercury-levels-commercial-fish-and-shellfish-1990-2012
- https://nap.nationalacademies.org/read/11762/chapter/6#167

Infographic
All nutrients comparison - raw data values
| Nutrient | |
|
DV% diff. |
| Selenium | 76.2µg | 37.6µg | 70% |
| Vitamin B12 | 1.59µg | 1.05µg | 23% |
| Vitamin D* | 183 IU | 46 IU | 17% |
| Vitamin D | 4.6µg | 1.2µg | 17% |
| Phosphorus | 248mg | 138mg | 16% |
| Vitamin B2 | 0.226mg | 0.079mg | 11% |
| Potassium | 467mg | 244mg | 7% |
| Vitamin B1 | 0.027mg | 0.088mg | 5% |
| Vitamin B5 | 0.404mg | 0.18mg | 4% |
| Vitamin B6 | 0.241mg | 0.283mg | 3% |
| Cholesterol | 61mg | 55mg | 2% |
| Magnesium | 33mg | 42mg | 2% |
| Iron | 0.36mg | 0.49mg | 2% |
| Vitamin E | 0.44mg | 0.81mg | 2% |
| Vitamin B3 | 2.897mg | 2.513mg | 2% |
| Protein | 22.23g | 22.83g | 1% |
| Fats | 1.62g | 0.86g | 1% |
| Vitamin C | 0mg | 1mg | 1% |
| Copper | 0.041mg | 0.036mg | 1% |
| Zinc | 0.43mg | 0.58mg | 1% |
| Vitamin A | 5µg | 14µg | 1% |
| Folate | 10µg | 8µg | 1% |
| Choline | 78.7mg | 83.7mg | 1% |
| Saturated fat | 0.42g | 0.168g | 1% |
| Monounsaturated fat | 0.466g | 0.124g | 1% |
| Polyunsaturated fat | 0.485g | 0.292g | 1% |
| Calories | 109kcal | 105kcal | 0% |
| Protein per 100 calories | 20g | 22g | N/A |
| Calories per 10 g protein | 49kcal | 46kcal | N/A |
| Weight per 100 calories | 92g | 95g | N/A |
| Calcium | 17mg | 14mg | 0% |
| Sodium | 89mg | 78mg | 0% |
| Manganese | 0.013mg | 0.02mg | 0% |
| Vitamin K | 0µg | 0.1µg | 0% |
| Trans fat | 0.025g | N/A | |
| Tryptophan | 0.296mg | 0.256mg | 0% |
| Threonine | 1.014mg | 1.001mg | 0% |
| Isoleucine | 1.06mg | 1.052mg | 0% |
| Leucine | 1.835mg | 1.856mg | 0% |
| Lysine | 2.188mg | 2.097mg | 0% |
| Methionine | 0.707mg | 0.676mg | 0% |
| Phenylalanine | 0.935mg | 0.891mg | 0% |
| Valine | 1.106mg | 1.176mg | 0% |
| Histidine | 0.502mg | 0.672mg | 0% |
| Omega-3 - EPA | 0.107g | 0.004g | N/A |
| Omega-3 - DHA | 0.238g | 0.154g | N/A |
| Omega-3 - DPA | 0.027g | 0.013g | N/A |
| Omega-6 - Eicosadienoic acid | 0.005g | N/A |
People also compare


References
All the values for which the sources are not specified explicitly are taken from FDA’s Food Central. The exact link to the food presented on this page can be found below.
- Rockfish - https://fdc.nal.usda.gov/fdc-app.html#/food-details/175131/nutrients
- Cod - https://fdc.nal.usda.gov/fdc-app.html#/food-details/171956/nutrients
All the Daily Values are presented for males aged 31-50, for 2000-calorie diets.