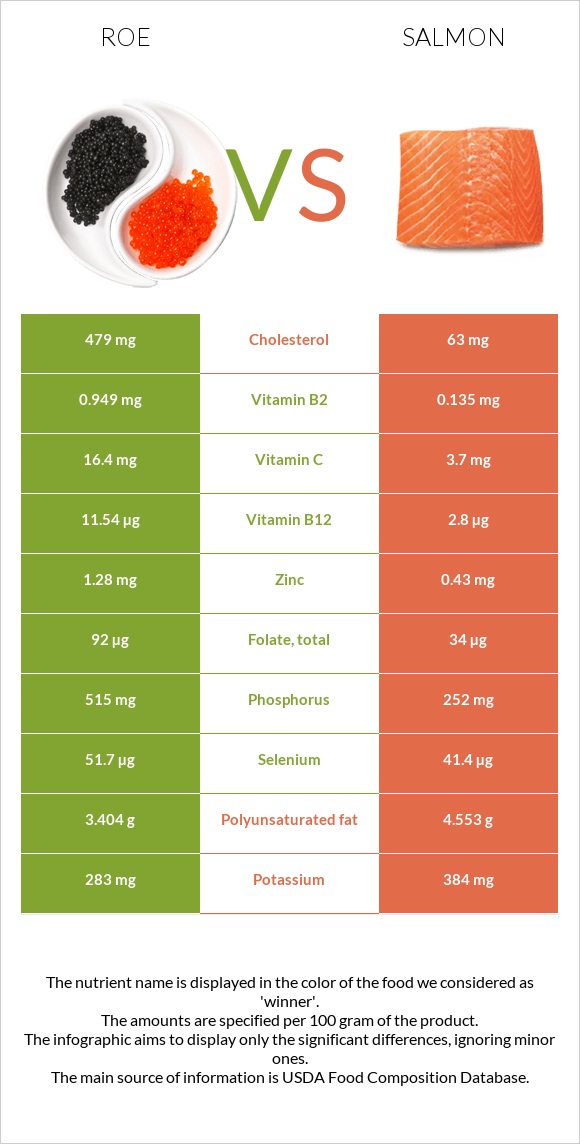
The main differences between roe and salmon Roe is richer in vitamin B12, vitamin B2, phosphorus, selenium, folate, vitamin C, and copper, yet salmon is richer in vitamin B3 and vitamin B6. Daily need coverage for vitamin B12 for roe is 364% higher. Roe contains 8 times more cholesterol than salmon. Roe contains 479mg of cholesterol, while salmon contains 63mg. Salmon has a lower glycemic index than roe. Food types used in this article are Fish, roe, mixed species, cooked, dry heat and Fish, salmon, Atlantic, farmed, cooked, dry heat .
Infographic
Mineral Comparison
Mineral comparison score is based on the number of minerals by which one or the other food is richer. The "coverage" charts below show how much of the daily needs can be covered by 300 grams of the food.
6
100 g
300 g
1 oz - 28.35g 3 oz - 85g
Magnesium
Magnesium
Calcium
Calcium
Potassium
Potassium
Iron
Iron
Copper
Copper
Zinc
Zinc
Phosphorus
Phosphorus
Sodium
Sodium
Manganese
Manganese
Selenium
Selenium
19%
8.4%
25%
29%
43%
35%
221%
15%
1.7%
282%
4
100 g
300 g
3 oz - 85g 0.5 fillet - 178g
Magnesium
Magnesium
Calcium
Calcium
Potassium
Potassium
Iron
Iron
Copper
Copper
Zinc
Zinc
Phosphorus
Phosphorus
Sodium
Sodium
Manganese
Manganese
Selenium
Selenium
21%
4.5%
34%
13%
16%
12%
108%
8%
2.1%
226%
Vitamin Comparison
Vitamin comparison score is based on the number of vitamins by which one or the other food is richer. The "coverage" charts below show how much of the daily needs can be covered by 300 grams of the food.
5
100 g
300 g
1 oz - 28.35g 3 oz - 85g
Vitamin C
Vit. C
Vitamin D
Vit. D
Vitamin A
Vit. A
Vitamin E
Vit. E
Vitamin B1
Vit. B1
Vitamin B2
Vit. B2
Vitamin B3
Vit. B3
Vitamin B5
Vit. B5
Vitamin B6
Vit. B6
Vitamin B12
Vit. B12
Vitamin K
Vit. K
Folate
Folate
55%
0%
30%
0%
69%
219%
41%
69%
43%
1443%
0%
69%
7
100 g
300 g
3 oz - 85g 0.5 fillet - 178g
Vitamin C
Vit. C
Vitamin D
Vit. D
Vitamin A
Vit. A
Vitamin E
Vit. E
Vitamin B1
Vit. B1
Vitamin B2
Vit. B2
Vitamin B3
Vit. B3
Vitamin B5
Vit. B5
Vitamin B6
Vit. B6
Vitamin B12
Vit. B12
Vitamin K
Vit. K
Folate
Folate
12%
197%
23%
23%
85%
31%
151%
89%
149%
350%
0.25%
26%
All nutrients comparison - raw data values
Nutrient
DV% diff.
Vitamin B12
11.54µg
2.8µg
364%
Cholesterol
479mg
63mg
139%
Vitamin D*
526 IU
66%
Vitamin D
13.1µg
66%
Vitamin B2
0.949mg
0.135mg
63%
Phosphorus
515mg
252mg
38%
Vitamin B3
2.192mg
8.045mg
37%
Vitamin B6
0.185mg
0.647mg
36%
Selenium
51.7µg
41.4µg
19%
Choline
90.5mg
16%
Folate
92µg
34µg
15%
Vitamin C
16.4mg
3.7mg
14%
Protein
28.62g
22.1g
13%
Copper
0.128mg
0.049mg
9%
Zinc
1.28mg
0.43mg
8%
Vitamin E
1.14mg
8%
Polyunsaturated fat
3.404g
4.553g
8%
Fats
8.23g
12.35g
6%
Vitamin B5
1.154mg
1.475mg
6%
Iron
0.77mg
0.34mg
5%
Vitamin B1
0.277mg
0.34mg
5%
Monounsaturated fat
2.129g
4.181g
5%
Potassium
283mg
384mg
3%
Sodium
117mg
61mg
2%
Vitamin A
91µg
69µg
2%
Saturated fat
1.866g
2.397g
2%
Carbs
1.92g
0g
1%
Magnesium
26mg
30mg
1%
Calcium
28mg
15mg
1%
Calories
204kcal
206kcal
0%
Protein per 100 calories
14g
11g
N/A
Calories per 10 g protein
71kcal
93kcal
N/A
Weight per 100 calories
49g
49g
N/A
Unsaturated / Saturated Fat ratio
3
3.6
N/A
Net carbs
1.92g
0g
N/A
Manganese
0.013mg
0.016mg
0%
Vitamin K
0.1µg
0%
Tryptophan
0.375mg
0.248mg
0%
Threonine
1.305mg
0.969mg
0%
Isoleucine
1.465mg
1.018mg
0%
Leucine
2.509mg
1.796mg
0%
Lysine
2.179mg
2.03mg
0%
Methionine
0.71mg
0.654mg
0%
Phenylalanine
1.401mg
0.863mg
0%
Valine
1.676mg
1.139mg
0%
Histidine
0.778mg
0.651mg
0%
Omega-3 - EPA
1.26g
0.69g
N/A
Omega-3 - DHA
1.747g
1.457g
N/A
Omega-3 - DPA
0.105g
0.17g
N/A
Macronutrient Comparison
Macronutrient breakdown side-by-side comparison
3
29%
8%
2%
59%
3%
Protein:
28.62 g
Fats:
8.23 g
Carbs:
1.92 g
Water:
58.63 g
Other:
2.6 g
2
22%
12%
65%
Protein:
22.1 g
Fats:
12.35 g
Carbs:
0 g
Water:
64.75 g
Other:
0.8 g
Contains
more
Protein Protein
+29.5%
Contains
more
Carbs Carbs
+∞%
Contains
more
Other Other
+225%
Contains
more
Fats Fats
+50.1%
Contains
more
Water Water
+10.4%
Fat Type Comparison
Fat type breakdown side-by-side comparison
1
25%
29%
46%
Saturated fat:
Sat. Fat
1.866 g
Monounsaturated fat:
Mono. Fat
2.129 g
Polyunsaturated fat:
Poly. Fat
3.404 g
2
22%
38%
41%
Saturated fat:
Sat. Fat
2.397 g
Monounsaturated fat:
Mono. Fat
4.181 g
Polyunsaturated fat:
Poly. Fat
4.553 g
Contains
less
Sat. Fat Saturated fat
-22.2%
Contains
more
Mono. Fat Monounsaturated fat
+96.4%
Contains
more
Poly. Fat Polyunsaturated fat
+33.8%