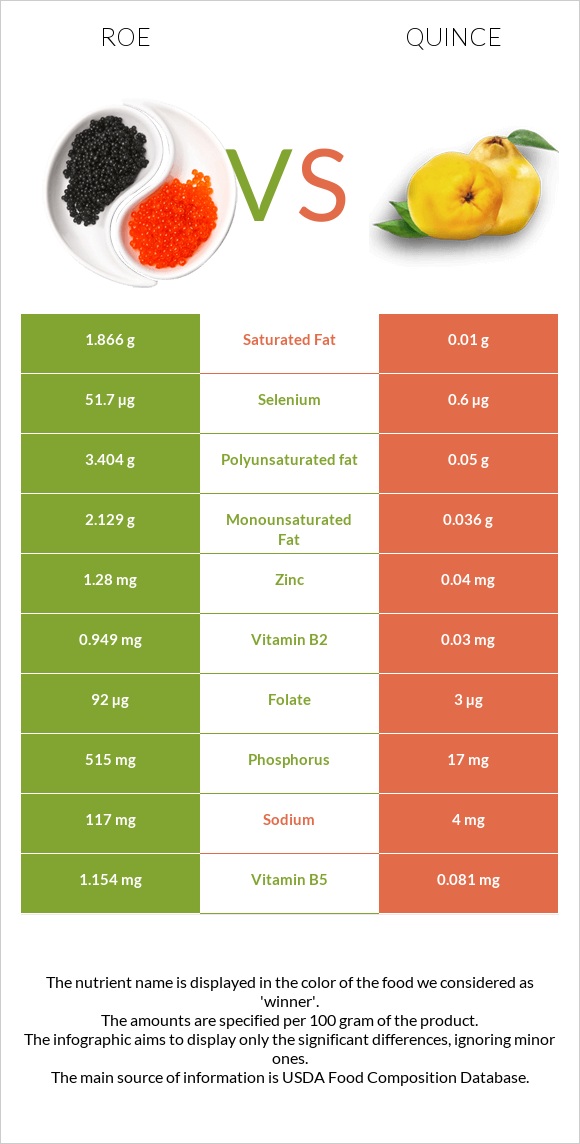
Summary of differences between roe and quince Quince has less vitamin B12, selenium, phosphorus, vitamin B2, folate, vitamin B5, vitamin B1, vitamin B3, and zinc than roe. Roe covers your daily need for vitamin B12, 481% more than quince. These are the specific foods used in this comparison Fish, roe, mixed species, cooked, dry heat and Quinces, raw .
Infographic
Mineral Comparison
Mineral comparison score is based on the number of minerals by which one or the other food is richer. The "coverage" charts below show how much of the daily needs can be covered by 300 grams of the food.
7
100 g
300 g
1 oz - 28.35g 3 oz - 85g
Magnesium
Magnesium
Calcium
Calcium
Potassium
Potassium
Iron
Iron
Copper
Copper
Zinc
Zinc
Phosphorus
Phosphorus
Sodium
Sodium
Manganese
Manganese
Selenium
Selenium
19%
8.4%
25%
29%
43%
35%
221%
15%
1.7%
282%
1
100 g
300 g
1 fruit without refuse - 92g
Magnesium
Magnesium
Calcium
Calcium
Potassium
Potassium
Iron
Iron
Copper
Copper
Zinc
Zinc
Phosphorus
Phosphorus
Sodium
Sodium
Manganese
Manganese
Selenium
Selenium
5.7%
3.3%
17%
26%
43%
1.1%
7.3%
0.52%
0%
3.3%
Vitamin Comparison
Vitamin comparison score is based on the number of vitamins by which one or the other food is richer. The "coverage" charts below show how much of the daily needs can be covered by 300 grams of the food.
8
100 g
300 g
1 oz - 28.35g 3 oz - 85g
Vitamin C
Vit. C
Vitamin D
Vit. D
Vitamin A
Vit. A
Vitamin E
Vit. E
Vitamin B1
Vit. B1
Vitamin B2
Vit. B2
Vitamin B3
Vit. B3
Vitamin B5
Vit. B5
Vitamin B6
Vit. B6
Vitamin B12
Vit. B12
Vitamin K
Vit. K
Folate
Folate
55%
0%
30%
0%
69%
219%
41%
69%
43%
1443%
0%
69%
0
100 g
300 g
1 fruit without refuse - 92g
Vitamin C
Vit. C
Vitamin D
Vit. D
Vitamin A
Vit. A
Vitamin E
Vit. E
Vitamin B1
Vit. B1
Vitamin B2
Vit. B2
Vitamin B3
Vit. B3
Vitamin B5
Vit. B5
Vitamin B6
Vit. B6
Vitamin B12
Vit. B12
Vitamin K
Vit. K
Folate
Folate
50%
0%
0.67%
0%
5%
6.9%
3.8%
4.9%
9.2%
0%
0%
2.3%
All nutrients comparison - raw data values
Nutrient
DV% diff.
Vitamin B12
11.54µg
0µg
481%
Cholesterol
479mg
0mg
160%
Selenium
51.7µg
0.6µg
93%
Phosphorus
515mg
17mg
71%
Vitamin B2
0.949mg
0.03mg
71%
Protein
28.62g
0.4g
56%
Folate
92µg
3µg
22%
Polyunsaturated fat
3.404g
0.05g
22%
Vitamin B1
0.277mg
0.02mg
21%
Vitamin B5
1.154mg
0.081mg
21%
Fats
8.23g
0.1g
13%
Vitamin B3
2.192mg
0.2mg
12%
Zinc
1.28mg
0.04mg
11%
Vitamin B6
0.185mg
0.04mg
11%
Vitamin A
91µg
2µg
10%
Fiber
0g
1.9g
8%
Saturated fat
1.866g
0.01g
8%
Calories
204kcal
57kcal
7%
Sodium
117mg
4mg
5%
Monounsaturated fat
2.129g
0.036g
5%
Carbs
1.92g
15.3g
4%
Magnesium
26mg
8mg
4%
Potassium
283mg
197mg
3%
Vitamin C
16.4mg
15mg
2%
Calcium
28mg
11mg
2%
Iron
0.77mg
0.7mg
1%
Manganese
0.013mg
1%
Protein per 100 calories
14g
0.7g
N/A
Calories per 10 g protein
71kcal
1425kcal
N/A
Weight per 100 calories
49g
175g
N/A
Unsaturated / Saturated Fat ratio
3
8.6
N/A
Net carbs
1.92g
13.4g
N/A
Copper
0.128mg
0.13mg
0%
Tryptophan
0.375mg
0%
Threonine
1.305mg
0%
Isoleucine
1.465mg
0%
Leucine
2.509mg
0%
Lysine
2.179mg
0%
Methionine
0.71mg
0%
Phenylalanine
1.401mg
0%
Valine
1.676mg
0%
Histidine
0.778mg
0%
Omega-3 - EPA
1.26g
0g
N/A
Omega-3 - DHA
1.747g
0g
N/A
Omega-3 - DPA
0.105g
0g
N/A
Macronutrient Comparison
Macronutrient breakdown side-by-side comparison
3
29%
8%
2%
59%
3%
Protein:
28.62 g
Fats:
8.23 g
Carbs:
1.92 g
Water:
58.63 g
Other:
2.6 g
2
15%
84%
Protein:
0.4 g
Fats:
0.1 g
Carbs:
15.3 g
Water:
83.8 g
Other:
0.4 g
Contains
more
Protein Protein
+7055%
Contains
more
Fats Fats
+8130%
Contains
more
Other Other
+550%
Contains
more
Carbs Carbs
+696.9%
Contains
more
Water Water
+42.9%
Fat Type Comparison
Fat type breakdown side-by-side comparison
2
25%
29%
46%
Saturated fat:
Sat. Fat
1.866 g
Monounsaturated fat:
Mono. Fat
2.129 g
Polyunsaturated fat:
Poly. Fat
3.404 g
1
10%
38%
52%
Saturated fat:
Sat. Fat
0.01 g
Monounsaturated fat:
Mono. Fat
0.036 g
Polyunsaturated fat:
Poly. Fat
0.05 g
Contains
more
Mono. Fat Monounsaturated fat
+5813.9%
Contains
more
Poly. Fat Polyunsaturated fat
+6708%
Contains
less
Sat. Fat Saturated fat
-99.5%