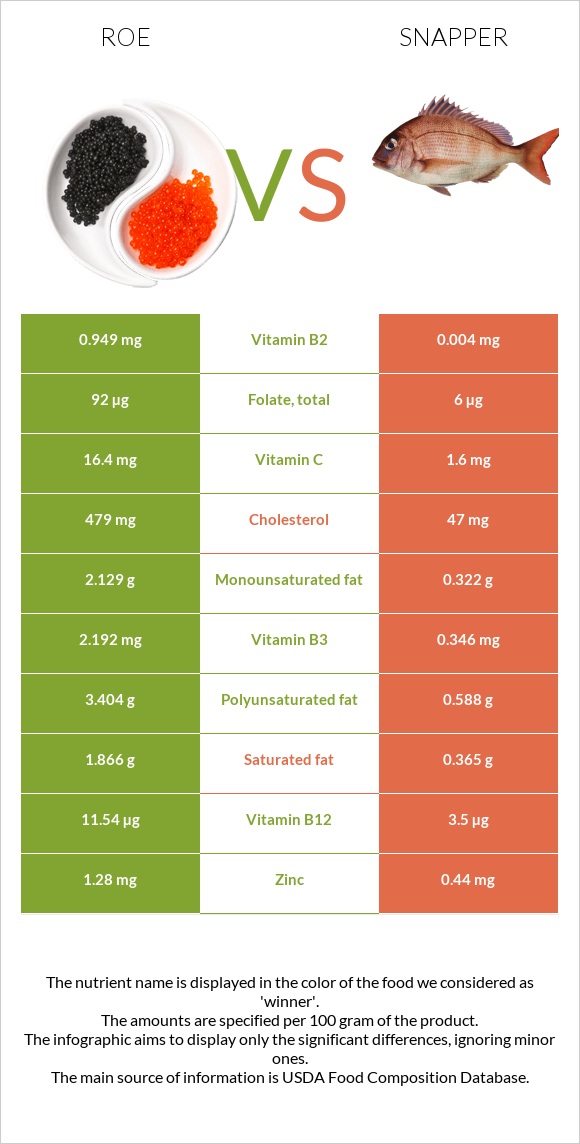
How are roe and snapper different? Roe is higher in vitamin B12, vitamin B2, phosphorus, folate, vitamin B1, vitamin C, vitamin B3, and copper; however, snapper is richer in vitamin B6. Daily need coverage for vitamin B12 for roe is 335% higher. Roe contains 237 times more vitamin B2 than snapper. While roe contains 0.949mg of vitamin B2, snapper contains only 0.004mg. Snapper has less cholesterol. Snapper has a lower glycemic index (0) than roe (27). Fish, roe, mixed species, cooked, dry heat and Fish, snapper, mixed species, cooked, dry heat are the varieties used in this article.
Infographic
Mineral Comparison
Mineral comparison score is based on the number of minerals by which one or the other food is richer. The "coverage" charts below show how much of the daily needs can be covered by 300 grams of the food.
4
100 g
300 g
1 oz - 28.35g 3 oz - 85g
Magnesium
Magnesium
Calcium
Calcium
Potassium
Potassium
Iron
Iron
Copper
Copper
Zinc
Zinc
Phosphorus
Phosphorus
Sodium
Sodium
Manganese
Manganese
Selenium
Selenium
19%
8.4%
25%
29%
43%
35%
221%
15%
1.7%
282%
5
100 g
300 g
3 oz - 85g 1 fillet - 170g
Magnesium
Magnesium
Calcium
Calcium
Potassium
Potassium
Iron
Iron
Copper
Copper
Zinc
Zinc
Phosphorus
Phosphorus
Sodium
Sodium
Manganese
Manganese
Selenium
Selenium
26%
12%
46%
9%
15%
12%
86%
7.4%
2.2%
267%
Vitamin Comparison
Vitamin comparison score is based on the number of vitamins by which one or the other food is richer. The "coverage" charts below show how much of the daily needs can be covered by 300 grams of the food.
8
100 g
300 g
1 oz - 28.35g 3 oz - 85g
Vitamin C
Vit. C
Vitamin D
Vit. D
Vitamin A
Vit. A
Vitamin E
Vit. E
Vitamin B1
Vit. B1
Vitamin B2
Vit. B2
Vitamin B3
Vit. B3
Vitamin B5
Vit. B5
Vitamin B6
Vit. B6
Vitamin B12
Vit. B12
Vitamin K
Vit. K
Folate
Folate
55%
0%
30%
0%
69%
219%
41%
69%
43%
1443%
0%
69%
1
100 g
300 g
3 oz - 85g 1 fillet - 170g
Vitamin C
Vit. C
Vitamin D
Vit. D
Vitamin A
Vit. A
Vitamin E
Vit. E
Vitamin B1
Vit. B1
Vitamin B2
Vit. B2
Vitamin B3
Vit. B3
Vitamin B5
Vit. B5
Vitamin B6
Vit. B6
Vitamin B12
Vit. B12
Vitamin K
Vit. K
Folate
Folate
5.3%
0%
12%
0%
13%
0.92%
6.5%
52%
106%
438%
0%
4.5%
All nutrients comparison - raw data values
Nutrient
DV% diff.
Vitamin B12
11.54µg
3.5µg
335%
Cholesterol
479mg
47mg
144%
Vitamin B2
0.949mg
0.004mg
73%
Phosphorus
515mg
201mg
45%
Folate
92µg
6µg
22%
Vitamin B6
0.185mg
0.46mg
21%
Vitamin B1
0.277mg
0.053mg
19%
Polyunsaturated fat
3.404g
0.588g
19%
Vitamin C
16.4mg
1.6mg
16%
Vitamin B3
2.192mg
0.346mg
12%
Fats
8.23g
1.72g
10%
Copper
0.128mg
0.046mg
9%
Zinc
1.28mg
0.44mg
8%
Potassium
283mg
522mg
7%
Iron
0.77mg
0.24mg
7%
Saturated fat
1.866g
0.365g
7%
Vitamin A
91µg
35µg
6%
Vitamin B5
1.154mg
0.87mg
6%
Protein
28.62g
26.3g
5%
Selenium
51.7µg
49µg
5%
Monounsaturated fat
2.129g
0.322g
5%
Calories
204kcal
128kcal
4%
Magnesium
26mg
37mg
3%
Sodium
117mg
57mg
3%
Carbs
1.92g
0g
1%
Calcium
28mg
40mg
1%
Protein per 100 calories
14g
21g
N/A
Calories per 10 g protein
71kcal
49kcal
N/A
Weight per 100 calories
49g
78g
N/A
Unsaturated / Saturated Fat ratio
3
2.5
N/A
Net carbs
1.92g
0g
N/A
Manganese
0.013mg
0.017mg
0%
Tryptophan
0.375mg
0.294mg
0%
Threonine
1.305mg
1.153mg
0%
Isoleucine
1.465mg
1.212mg
0%
Leucine
2.509mg
2.137mg
0%
Lysine
2.179mg
2.415mg
0%
Methionine
0.71mg
0.778mg
0%
Phenylalanine
1.401mg
1.027mg
0%
Valine
1.676mg
1.355mg
0%
Histidine
0.778mg
0.774mg
0%
Omega-3 - EPA
1.26g
0.048g
N/A
Omega-3 - DHA
1.747g
0.273g
N/A
Omega-3 - DPA
0.105g
0.022g
N/A
Macronutrient Comparison
Macronutrient breakdown side-by-side comparison
4
29%
8%
2%
59%
3%
Protein:
28.62 g
Fats:
8.23 g
Carbs:
1.92 g
Water:
58.63 g
Other:
2.6 g
1
26%
2%
70%
Protein:
26.3 g
Fats:
1.72 g
Carbs:
0 g
Water:
70.35 g
Other:
1.63 g
Contains
more
Fats Fats
+378.5%
Contains
more
Carbs Carbs
+∞%
Contains
more
Other Other
+59.5%
Contains
more
Water Water
+20%
Fat Type Comparison
Fat type breakdown side-by-side comparison
2
25%
29%
46%
Saturated fat:
Sat. Fat
1.866 g
Monounsaturated fat:
Mono. Fat
2.129 g
Polyunsaturated fat:
Poly. Fat
3.404 g
1
29%
25%
46%
Saturated fat:
Sat. Fat
0.365 g
Monounsaturated fat:
Mono. Fat
0.322 g
Polyunsaturated fat:
Poly. Fat
0.588 g
Contains
more
Mono. Fat Monounsaturated fat
+561.2%
Contains
more
Poly. Fat Polyunsaturated fat
+478.9%
Contains
less
Sat. Fat Saturated fat
-80.4%