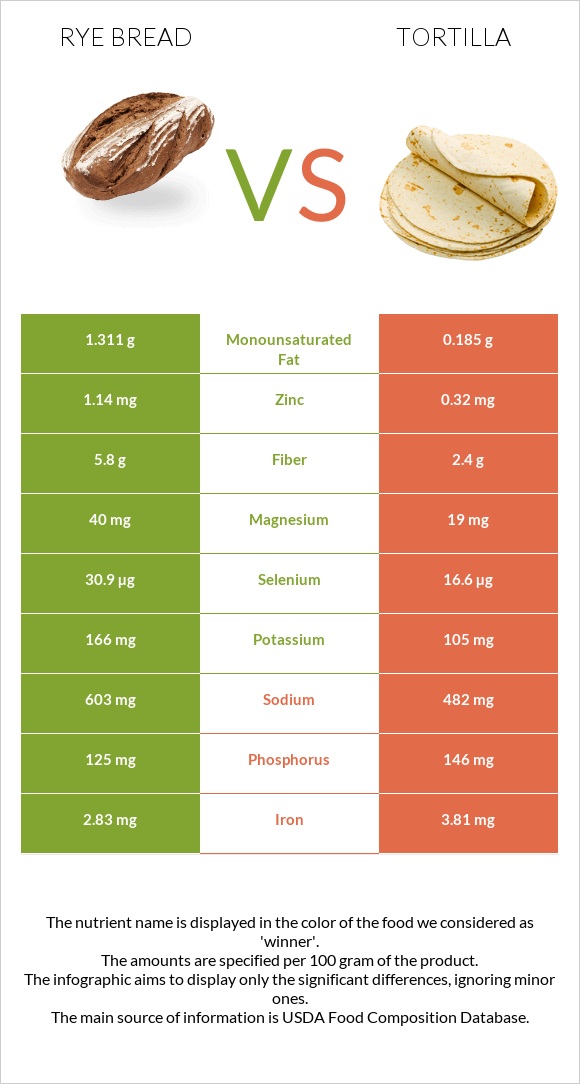
A recap on the differences between rye bread and tortillas Rye bread has less vitamin B1, phosphorus, vitamin B6, calcium, fiber, selenium, magnesium, copper, and zinc. Tortillas cover your daily vitamin B1 needs 32% more than rye bread. Rye bread has less saturated fat. Food varieties used in this article are Bread, rye and Tortillas, ready-to-bake or -fry, whole wheat .
Infographic
Mineral Comparison
Mineral comparison score is based on the number of minerals by which one or the other food is richer. The "coverage" charts below show how much of the daily needs can be covered by 300 grams of the food.
1
100 g
300 g
1 slice, snack-size - 7g 1 slice, thin - 25g 1 oz - 28.35g 1 slice, regular - 32g
Magnesium
Magnesium
Calcium
Calcium
Potassium
Potassium
Iron
Iron
Copper
Copper
Zinc
Zinc
Phosphorus
Phosphorus
Sodium
Sodium
Manganese
Manganese
Selenium
Selenium
29%
22%
15%
106%
62%
31%
54%
79%
107%
169%
8
100 g
300 g
1 tortilla 1 serving - 41g
Magnesium
Magnesium
Calcium
Calcium
Potassium
Potassium
Iron
Iron
Copper
Copper
Zinc
Zinc
Phosphorus
Phosphorus
Sodium
Sodium
Manganese
Manganese
Selenium
Selenium
61%
73%
23%
99%
89%
52%
148%
67%
0%
202%
Vitamin Comparison
Vitamin comparison score is based on the number of vitamins by which one or the other food is richer. The "coverage" charts below show how much of the daily needs can be covered by 300 grams of the food.
3
100 g
300 g
1 slice, snack-size - 7g 1 slice, thin - 25g 1 oz - 28.35g 1 slice, regular - 32g
Vitamin C
Vit. C
Vitamin D
Vit. D
Vitamin A
Vit. A
Vitamin E
Vit. E
Vitamin B1
Vit. B1
Vitamin B2
Vit. B2
Vitamin B3
Vit. B3
Vitamin B5
Vit. B5
Vitamin B6
Vit. B6
Vitamin B12
Vit. B12
Vitamin K
Vit. K
Folate
Folate
1.3%
0%
0%
6.6%
109%
77%
71%
26%
17%
0%
3%
83%
6
100 g
300 g
1 tortilla 1 serving - 41g
Vitamin C
Vit. C
Vitamin D
Vit. D
Vitamin A
Vit. A
Vitamin E
Vit. E
Vitamin B1
Vit. B1
Vitamin B2
Vit. B2
Vitamin B3
Vit. B3
Vitamin B5
Vit. B5
Vitamin B6
Vit. B6
Vitamin B12
Vit. B12
Vitamin K
Vit. K
Folate
Folate
0%
0%
0%
18%
206%
67%
91%
0%
72%
0%
11%
104%
All nutrients comparison - raw data values
Nutrient
DV% diff.
Manganese
0.824mg
36%
Phosphorus
125mg
346mg
32%
Vitamin B1
0.434mg
0.823mg
32%
Saturated fat
0.626g
4.878g
19%
Vitamin B6
0.075mg
0.312mg
18%
Calcium
73mg
244mg
17%
Fiber
5.8g
9.8g
16%
Magnesium
40mg
85mg
11%
Selenium
30.9µg
37µg
11%
Fats
3.3g
9.76g
10%
Copper
0.186mg
0.266mg
9%
Vitamin B5
0.44mg
9%
Zinc
1.14mg
1.92mg
7%
Vitamin B3
3.805mg
4.858mg
7%
Folate
110µg
138µg
7%
Sodium
603mg
512mg
4%
Vitamin E
0.33mg
0.9mg
4%
Vitamin B2
0.335mg
0.289mg
4%
Monounsaturated fat
1.311g
3.062g
4%
Calories
259kcal
310kcal
3%
Protein
8.5g
9.76g
3%
Potassium
166mg
262mg
3%
Iron
2.83mg
2.63mg
3%
Vitamin K
1.2µg
4.5µg
3%
Carbs
48.3g
45.89g
1%
Choline
14.6mg
20mg
1%
Polyunsaturated fat
0.799g
0.992g
1%
Protein per 100 calories
3.3g
3.1g
N/A
Calories per 10 g protein
305kcal
318kcal
N/A
Weight per 100 calories
39g
32g
N/A
Unsaturated / Saturated Fat ratio
3.4
0.83
N/A
Vitamin C
0.4mg
0mg
0%
Net carbs
42.5g
36.09g
N/A
Sugar
3.85g
2.44g
N/A
Tryptophan
0.096mg
0.129mg
0%
Threonine
0.255mg
0.312mg
0%
Isoleucine
0.319mg
0.353mg
0%
Leucine
0.579mg
0.671mg
0%
Lysine
0.233mg
0.37mg
0%
Methionine
0.139mg
0.163mg
0%
Phenylalanine
0.411mg
0.488mg
0%
Valine
0.379mg
0.444mg
0%
Histidine
0.182mg
0.255mg
0%
Macronutrient Comparison
Macronutrient breakdown side-by-side comparison
2
9%
3%
48%
37%
3%
Protein:
8.5 g
Fats:
3.3 g
Carbs:
48.3 g
Water:
37.3 g
Other:
2.6 g
3
10%
10%
46%
30%
4%
Protein:
9.76 g
Fats:
9.76 g
Carbs:
45.89 g
Water:
30.15 g
Other:
4.44 g
Contains
more
Water Water
+23.7%
Contains
more
Protein Protein
+14.8%
Contains
more
Fats Fats
+195.8%
Contains
more
Other Other
+70.8%
Fat Type Comparison
Fat type breakdown side-by-side comparison
1
23%
48%
29%
Saturated fat:
Sat. Fat
0.626 g
Monounsaturated fat:
Mono. Fat
1.311 g
Polyunsaturated fat:
Poly. Fat
0.799 g
2
55%
34%
11%
Saturated fat:
Sat. Fat
4.878 g
Monounsaturated fat:
Mono. Fat
3.062 g
Polyunsaturated fat:
Poly. Fat
0.992 g
Contains
less
Sat. Fat Saturated fat
-87.2%
Contains
more
Mono. Fat Monounsaturated fat
+133.6%
Contains
more
Poly. Fat Polyunsaturated fat
+24.2%