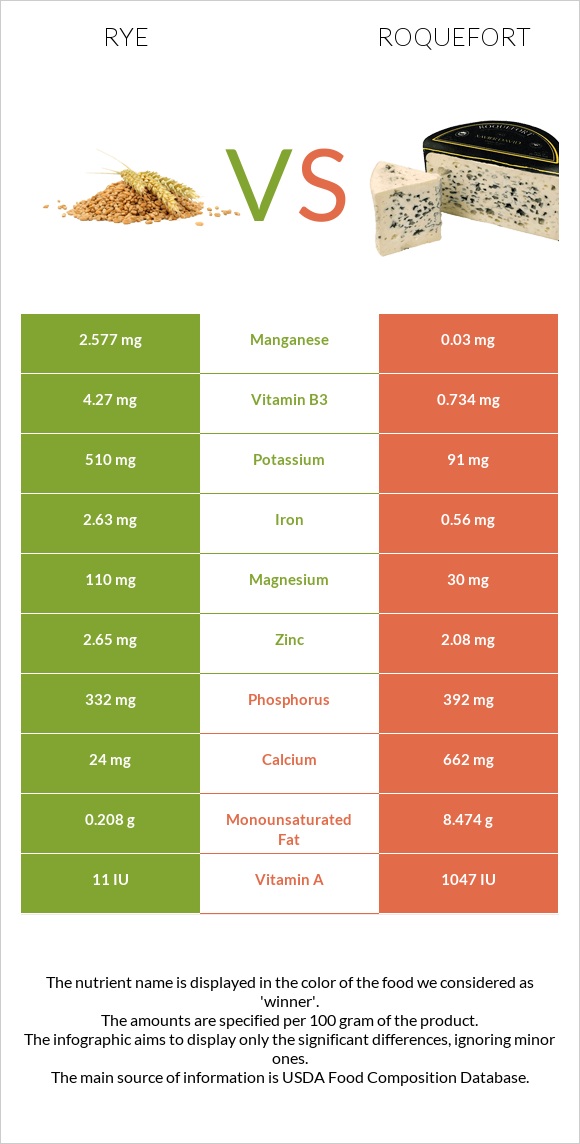
Differences between rye and roquefort Rye has more manganese, fiber, copper, and iron, while roquefort has more calcium, vitamin B12, and vitamin B2. Rye's daily need coverage for manganese is 111% higher. The amount of saturated fat in rye is lower. The food types used in this comparison are Rye grain and Cheese, roquefort .
Infographic
Mineral Comparison
Mineral comparison score is based on the number of minerals by which one or the other food is richer. The "coverage" charts below show how much of the daily needs can be covered by 300 grams of the food.
7
100 g
300 g
1 cup - 169g
Magnesium
Magnesium
Calcium
Calcium
Potassium
Potassium
Iron
Iron
Copper
Copper
Zinc
Zinc
Phosphorus
Phosphorus
Sodium
Sodium
Manganese
Manganese
Selenium
Selenium
79%
7.2%
45%
99%
122%
72%
142%
0.26%
336%
76%
2
100 g
300 g
1 oz - 28.35g 1 package (3 oz) - 85g
Magnesium
Magnesium
Calcium
Calcium
Potassium
Potassium
Iron
Iron
Copper
Copper
Zinc
Zinc
Phosphorus
Phosphorus
Sodium
Sodium
Manganese
Manganese
Selenium
Selenium
21%
199%
8%
21%
11%
57%
168%
236%
3.9%
79%
Vitamin Comparison
Vitamin comparison score is based on the number of vitamins by which one or the other food is richer. The "coverage" charts below show how much of the daily needs can be covered by 300 grams of the food.
5
100 g
300 g
1 cup - 169g
Vitamin C
Vit. C
Vitamin D
Vit. D
Vitamin A
Vit. A
Vitamin E
Vit. E
Vitamin B1
Vit. B1
Vitamin B2
Vit. B2
Vitamin B3
Vit. B3
Vitamin B5
Vit. B5
Vitamin B6
Vit. B6
Vitamin B12
Vit. B12
Vitamin K
Vit. K
Folate
Folate
0%
0%
0.33%
17%
79%
58%
80%
87%
68%
0%
15%
29%
5
100 g
300 g
1 oz - 28.35g 1 package (3 oz) - 85g
Vitamin C
Vit. C
Vitamin D
Vit. D
Vitamin A
Vit. A
Vitamin E
Vit. E
Vitamin B1
Vit. B1
Vitamin B2
Vit. B2
Vitamin B3
Vit. B3
Vitamin B5
Vit. B5
Vitamin B6
Vit. B6
Vitamin B12
Vit. B12
Vitamin K
Vit. K
Folate
Folate
0%
0%
98%
0%
10%
135%
14%
104%
29%
80%
0%
37%
All nutrients comparison - raw data values
Nutrient
DV% diff.
Manganese
2.577mg
0.03mg
111%
Saturated fat
0.197g
19.263g
87%
Sodium
2mg
1809mg
79%
Calcium
24mg
662mg
64%
Fiber
15.1g
0g
60%
Fats
1.63g
30.64g
45%
Copper
0.367mg
0.034mg
37%
Vitamin A
1µg
294µg
33%
Cholesterol
0mg
90mg
30%
Vitamin B12
0µg
0.64µg
27%
Iron
2.63mg
0.56mg
26%
Vitamin B2
0.251mg
0.586mg
26%
Carbs
75.86g
2g
25%
Vitamin B1
0.316mg
0.04mg
23%
Protein
10.34g
21.54g
22%
Vitamin B3
4.27mg
0.734mg
22%
Monounsaturated fat
0.208g
8.474g
21%
Magnesium
110mg
30mg
19%
Vitamin B6
0.294mg
0.124mg
13%
Potassium
510mg
91mg
12%
Phosphorus
332mg
392mg
9%
Vitamin E
0.85mg
6%
Vitamin B5
1.456mg
1.731mg
6%
Choline
30.4mg
6%
Zinc
2.65mg
2.08mg
5%
Vitamin K
5.9µg
5%
Polyunsaturated fat
0.767g
1.32g
4%
Folate
38µg
49µg
3%
Calories
338kcal
369kcal
2%
Selenium
13.9µg
14.5µg
1%
Protein per 100 calories
3.1g
5.8g
N/A
Calories per 10 g protein
327kcal
171kcal
N/A
Weight per 100 calories
30g
27g
N/A
Unsaturated / Saturated Fat ratio
4.9
0.51
N/A
Net carbs
60.76g
2g
N/A
Sugar
0.98g
N/A
Tryptophan
0.108mg
0.303mg
0%
Threonine
0.289mg
0.965mg
0%
Isoleucine
0.208mg
1.217mg
0%
Leucine
0.563mg
2.114mg
0%
Lysine
0.286mg
1.848mg
0%
Methionine
0.153mg
0.558mg
0%
Phenylalanine
0.435mg
1.023mg
0%
Valine
0.317mg
1.614mg
0%
Histidine
0.189mg
0.602mg
0%
Fructose
0.11g
0%
Macronutrient Comparison
Macronutrient breakdown side-by-side comparison
1
10%
76%
11%
Protein:
10.34 g
Fats:
1.63 g
Carbs:
75.86 g
Water:
10.6 g
Other:
1.57 g
4
22%
31%
2%
39%
6%
Protein:
21.54 g
Fats:
30.64 g
Carbs:
2 g
Water:
39.38 g
Other:
6.44 g
Contains
more
Carbs Carbs
+3693%
Contains
more
Protein Protein
+108.3%
Contains
more
Fats Fats
+1779.8%
Contains
more
Water Water
+271.5%
Contains
more
Other Other
+310.2%
Fat Type Comparison
Fat type breakdown side-by-side comparison
1
17%
18%
65%
Saturated fat:
Sat. Fat
0.197 g
Monounsaturated fat:
Mono. Fat
0.208 g
Polyunsaturated fat:
Poly. Fat
0.767 g
2
66%
29%
5%
Saturated fat:
Sat. Fat
19.263 g
Monounsaturated fat:
Mono. Fat
8.474 g
Polyunsaturated fat:
Poly. Fat
1.32 g
Contains
less
Sat. Fat Saturated fat
-99%
Contains
more
Mono. Fat Monounsaturated fat
+3974%
Contains
more
Poly. Fat Polyunsaturated fat
+72.1%