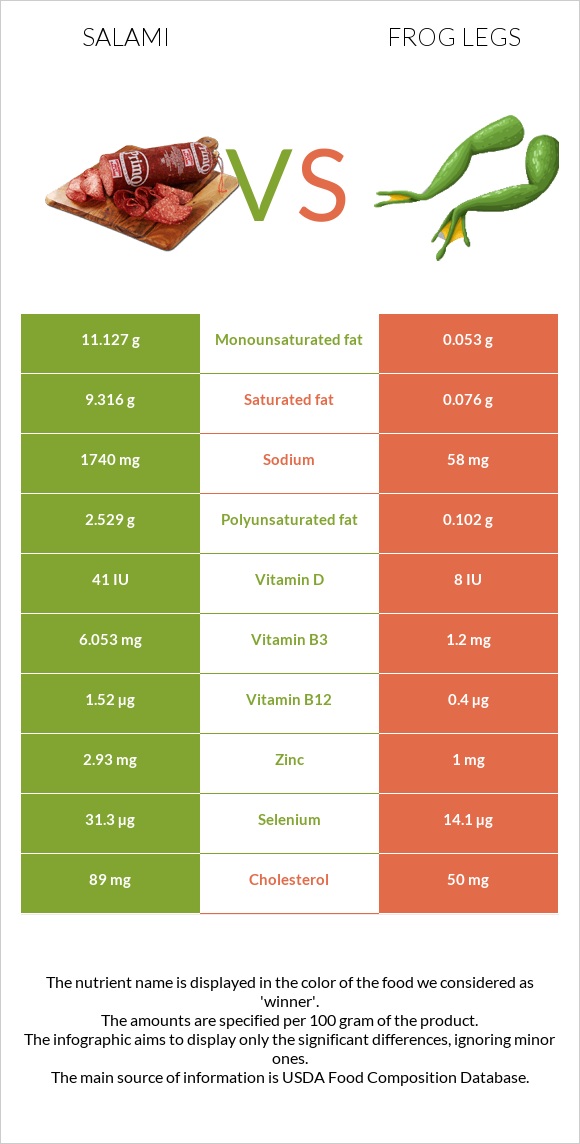
How are salami and frog legs different? Salami has more vitamin B12, selenium, vitamin B3, vitamin B6, vitamin B1, zinc, and copper than frog legs. Daily need coverage for sodium for salami is 73% higher. Salami contains 123 times more saturated fat than frog legs. While salami contains 9.316g of saturated fat, frog legs contain only 0.076g. Frog legs have a lower glycemic index (0) than salami (28). Salami, cooked, beef, and pork and Frog legs, raw are the varieties used in this article.
Infographic
Mineral Comparison
Mineral comparison score is based on the number of minerals by which one or the other food is richer. The "coverage" charts below show how much of the daily needs can be covered by 300 grams of the food.
5
100 g
300 g
1 slice round - 12.3g
Magnesium
Magnesium
Calcium
Calcium
Potassium
Potassium
Iron
Iron
Copper
Copper
Zinc
Zinc
Phosphorus
Phosphorus
Sodium
Sodium
Manganese
Manganese
Selenium
Selenium
14%
4.5%
28%
59%
119%
80%
82%
227%
128%
171%
2
100 g
300 g
1 leg - 45g
Magnesium
Magnesium
Calcium
Calcium
Potassium
Potassium
Iron
Iron
Copper
Copper
Zinc
Zinc
Phosphorus
Phosphorus
Sodium
Sodium
Manganese
Manganese
Selenium
Selenium
14%
5.4%
25%
56%
83%
27%
63%
7.6%
0%
77%
Vitamin Comparison
Vitamin comparison score is based on the number of vitamins by which one or the other food is richer. The "coverage" charts below show how much of the daily needs can be covered by 300 grams of the food.
8
100 g
300 g
1 slice round - 12.3g
Vitamin C
Vit. C
Vitamin D
Vit. D
Vitamin A
Vit. A
Vitamin E
Vit. E
Vitamin B1
Vit. B1
Vitamin B2
Vit. B2
Vitamin B3
Vit. B3
Vitamin B5
Vit. B5
Vitamin B6
Vit. B6
Vitamin B12
Vit. B12
Vitamin K
Vit. K
Folate
Folate
0%
15%
0%
4.4%
92%
82%
113%
72%
106%
190%
8%
2.3%
3
100 g
300 g
1 leg - 45g
Vitamin C
Vit. C
Vitamin D
Vit. D
Vitamin A
Vit. A
Vitamin E
Vit. E
Vitamin B1
Vit. B1
Vitamin B2
Vit. B2
Vitamin B3
Vit. B3
Vitamin B5
Vit. B5
Vitamin B6
Vit. B6
Vitamin B12
Vit. B12
Vitamin K
Vit. K
Folate
Folate
0%
3%
5%
20%
35%
58%
23%
0%
28%
50%
0.25%
11%
All nutrients comparison - raw data values
Nutrient
DV% diff.
Sodium
1740mg
58mg
73%
Vitamin B12
1.52µg
0.4µg
47%
Manganese
0.978mg
43%
Saturated fat
9.316g
0.076g
42%
Fats
25.9g
0.3g
39%
Selenium
31.3µg
14.1µg
31%
Vitamin B3
6.053mg
1.2mg
30%
Monounsaturated fat
11.127g
0.053g
28%
Vitamin B6
0.459mg
0.12mg
26%
Vitamin B5
1.201mg
24%
Vitamin B1
0.367mg
0.14mg
19%
Zinc
2.93mg
1mg
18%
Polyunsaturated fat
2.529g
0.102g
16%
Calories
336kcal
73kcal
13%
Cholesterol
89mg
50mg
13%
Copper
0.357mg
0.25mg
12%
Protein
21.85g
16.4g
11%
Vitamin B2
0.357mg
0.25mg
8%
Phosphorus
191mg
147mg
6%
Vitamin E
0.22mg
1mg
5%
Choline
93.5mg
65mg
5%
Vitamin D*
41 IU
8 IU
4%
Vitamin D
1µg
0.2µg
4%
Vitamin K
3.2µg
0.1µg
3%
Folate
3µg
15µg
3%
Vitamin A
0µg
15µg
2%
Carbs
2.4g
0g
1%
Potassium
316mg
285mg
1%
Iron
1.56mg
1.5mg
1%
Protein per 100 calories
6.5g
22g
N/A
Calories per 10 g protein
154kcal
45kcal
N/A
Weight per 100 calories
30g
137g
N/A
Unsaturated / Saturated Fat ratio
1.5
2
N/A
Net carbs
2.4g
0g
N/A
Magnesium
19mg
20mg
0%
Calcium
15mg
18mg
0%
Sugar
0.96g
0g
N/A
Trans fat
0.586g
N/A
Tryptophan
0.114mg
0%
Threonine
0.521mg
0%
Isoleucine
0.675mg
0%
Leucine
0.929mg
0%
Lysine
1.107mg
0%
Methionine
0.301mg
0%
Phenylalanine
0.481mg
0%
Valine
0.668mg
0%
Histidine
0.359mg
0%
Omega-3 - EPA
0g
0.014g
N/A
Omega-3 - DHA
0g
0.02g
N/A
Omega-3 - ALA
0.126g
N/A
Omega-3 - DPA
0g
0.007g
N/A
Omega-6 - Eicosadienoic acid
0.084g
N/A
Omega-6 - Linoleic acid
2.104g
N/A
Macronutrient Comparison
Macronutrient breakdown side-by-side comparison
4
22%
26%
2%
45%
5%
Protein:
21.85 g
Fats:
25.9 g
Carbs:
2.4 g
Water:
45.19 g
Other:
4.66 g
1
16%
82%
Protein:
16.4 g
Fats:
0.3 g
Carbs:
0 g
Water:
81.9 g
Other:
1.4 g
Contains
more
Protein Protein
+33.2%
Contains
more
Fats Fats
+8533.3%
Contains
more
Carbs Carbs
+∞%
Contains
more
Other Other
+232.9%
Contains
more
Water Water
+81.2%
Fat Type Comparison
Fat type breakdown side-by-side comparison
2
41%
48%
11%
Saturated fat:
Sat. Fat
9.316 g
Monounsaturated fat:
Mono. Fat
11.127 g
Polyunsaturated fat:
Poly. Fat
2.529 g
1
33%
23%
44%
Saturated fat:
Sat. Fat
0.076 g
Monounsaturated fat:
Mono. Fat
0.053 g
Polyunsaturated fat:
Poly. Fat
0.102 g
Contains
more
Mono. Fat Monounsaturated fat
+20894.3%
Contains
more
Poly. Fat Polyunsaturated fat
+2379.4%
Contains
less
Sat. Fat Saturated fat
-99.2%