Chia seeds vs. Durian — In-Depth Nutrition Comparison
Compare
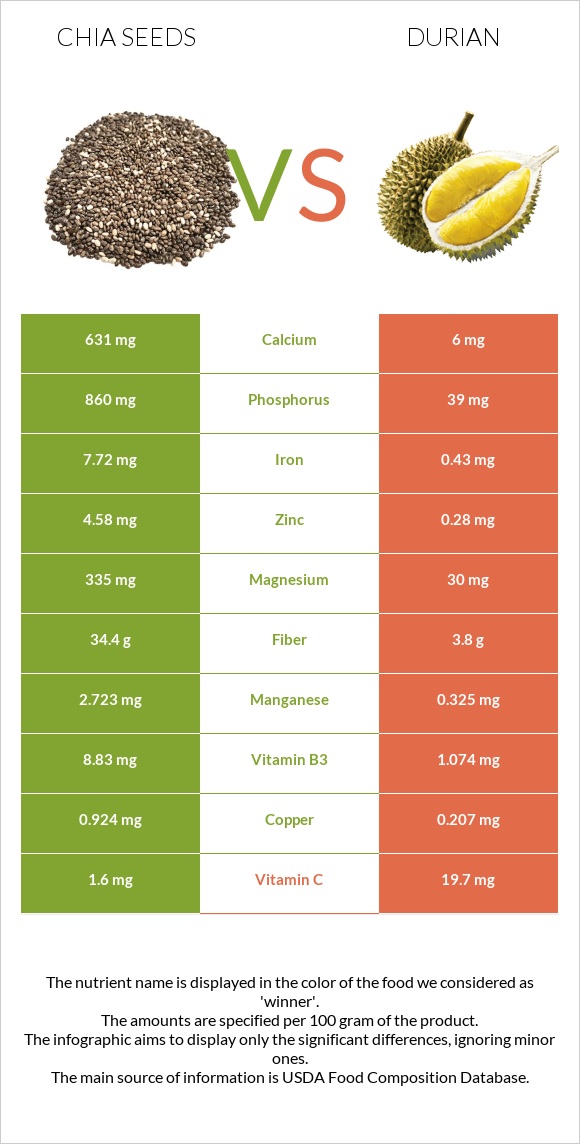
How are chia seeds and durian different?
- Chia seeds are higher than durian in fiber, phosphorus, manganese, iron, copper, magnesium, calcium, vitamin B3, zinc, and vitamin B1.
- Chia seeds cover your daily need for fiber, 122% more than durian.
- Chia seeds contain 105 times more calcium than durian. Chia seeds contain 631mg of calcium, while durian contains 6mg.
- Durian has a higher glycemic index (49) than chia seeds (15).
Seeds, chia seeds, dried and Durian, raw or frozen types were used in this article.
Infographic
Infographic link
Mineral Comparison
Mineral comparison score is based on the number of minerals by which one or the other food is richer. The "coverage" charts below show how much of the daily needs can be covered by 300 grams of the food.
| Contains more MagnesiumMagnesium | +1016.7% |
| Contains more CalciumCalcium | +10416.7% |
| Contains more IronIron | +1695.3% |
| Contains more CopperCopper | +346.4% |
| Contains more ZincZinc | +1535.7% |
| Contains more PhosphorusPhosphorus | +2105.1% |
| Contains more ManganeseManganese | +737.8% |
| Contains more SeleniumSelenium | +∞% |
| Contains less SodiumSodium | -87.5% |
Vitamin Comparison
Vitamin comparison score is based on the number of vitamins by which one or the other food is richer. The "coverage" charts below show how much of the daily needs can be covered by 300 grams of the food.
| Contains more Vitamin EVitamin E | +∞% |
| Contains more Vitamin B1Vitamin B1 | +65.8% |
| Contains more Vitamin B3Vitamin B3 | +722.2% |
| Contains more FolateFolate | +36.1% |
| Contains more Vitamin CVitamin C | +1131.3% |
| Contains more Vitamin B2Vitamin B2 | +17.6% |
All nutrients comparison - raw data values
| Nutrient |  |
 |
DV% diff. |
| Polyunsaturated fat | 23.665g | 158% | |
| Fiber | 34.4g | 3.8g | 122% |
| Phosphorus | 860mg | 39mg | 117% |
| Manganese | 2.723mg | 0.325mg | 104% |
| Selenium | 55.2µg | 100% | |
| Iron | 7.72mg | 0.43mg | 91% |
| Copper | 0.924mg | 0.207mg | 80% |
| Magnesium | 335mg | 30mg | 73% |
| Calcium | 631mg | 6mg | 63% |
| Vitamin B3 | 8.83mg | 1.074mg | 48% |
| Fats | 30.74g | 5.33g | 39% |
| Zinc | 4.58mg | 0.28mg | 39% |
| Protein | 16.54g | 1.47g | 30% |
| Vitamin B6 | 0.316mg | 24% | |
| Vitamin B1 | 0.62mg | 0.374mg | 21% |
| Vitamin C | 1.6mg | 19.7mg | 20% |
| Calories | 486kcal | 147kcal | 17% |
| Saturated fat | 3.33g | 15% | |
| Monounsaturated fat | 2.309g | 6% | |
| Carbs | 42.12g | 27.09g | 5% |
| Vitamin B5 | 0.23mg | 5% | |
| Vitamin E | 0.5mg | 3% | |
| Folate | 49µg | 36µg | 3% |
| Vitamin B2 | 0.17mg | 0.2mg | 2% |
| Potassium | 407mg | 436mg | 1% |
| Sodium | 16mg | 2mg | 1% |
| Net carbs | 7.72g | 23.29g | N/A |
| Vitamin A | 2µg | 0% | |
| Trans fat | 0.14g | 0g | N/A |
| Tryptophan | 0.436mg | 0% | |
| Threonine | 0.709mg | 0% | |
| Isoleucine | 0.801mg | 0% | |
| Leucine | 1.371mg | 0% | |
| Lysine | 0.97mg | 0% | |
| Methionine | 0.588mg | 0% | |
| Phenylalanine | 1.016mg | 0% | |
| Valine | 0.95mg | 0% | |
| Histidine | 0.531mg | 0% | |
| Omega-3 - ALA | 17.83g | N/A | |
| Omega-6 - Linoleic acid | 5.835g | N/A |
Macronutrient Comparison
Macronutrient breakdown side-by-side comparison
Protein:
16.54 g
Fats:
30.74 g
Carbs:
42.12 g
Water:
5.8 g
Other:
4.8 g
Protein:
1.47 g
Fats:
5.33 g
Carbs:
27.09 g
Water:
64.99 g
Other:
1.12 g
| Contains more ProteinProtein | +1025.2% |
| Contains more FatsFats | +476.7% |
| Contains more CarbsCarbs | +55.5% |
| Contains more OtherOther | +328.6% |
| Contains more WaterWater | +1020.5% |


