Chia seeds nutrition: calories, carbs, GI, protein, fiber, fats
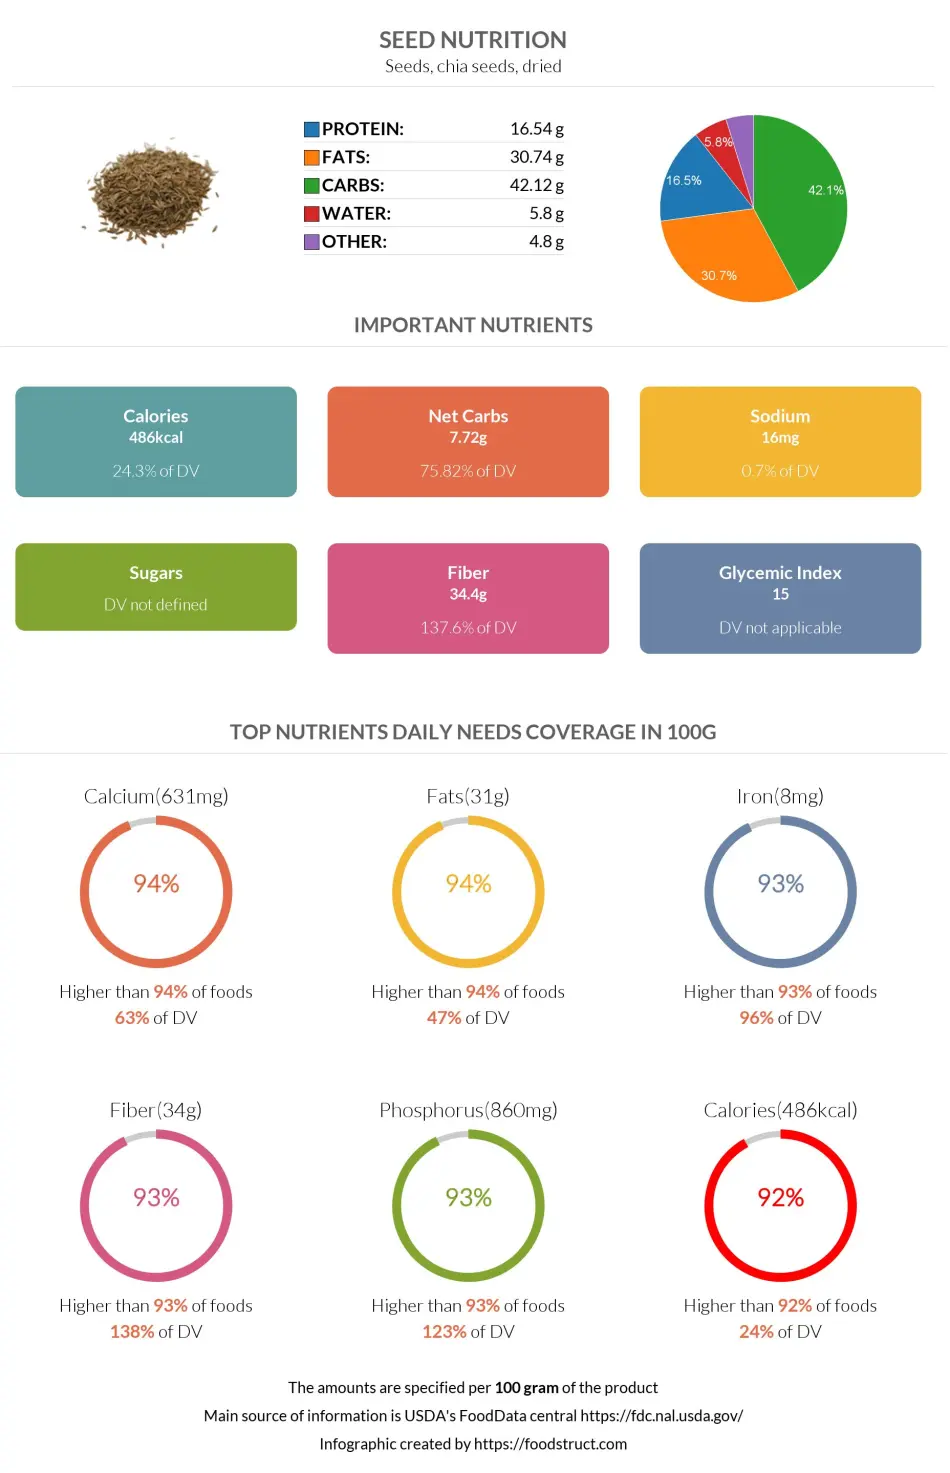
Seeds, chia seeds, dried
*all the values are displayed for the amount of 100 grams
Top nutrition facts for Chia seeds
| Calories ⓘ Calories for selected serving | 486 kcal |
| Fats | 30.74 g |
| Unsaturated / Saturated Fat ratio ⓘ (monounsaturated + polyunsaturated) / saturated, ≥2 broadly recommended by major guidelines for heart health | 7.8 |
| Fiber | 34.4 g |
| Magnesium | 335 mg |
| Net carbs ⓘ Net Carbs = Total Carbohydrates – Fiber – Sugar Alcohols | 8 g |
| Default serving size ⓘ Serving sizes are mostly taken from FDA's Reference Amounts Customarily Consumed (RACCs) | 1 oz (28.35 g) |
Phosphorus ⓘHigher in Phosphorus content than 99% of foods
Magnesium ⓘHigher in Magnesium content than 99% of foods
Fiber ⓘHigher in Fiber content than 99% of foods
Calcium ⓘHigher in Calcium content than 98% of foods
Selenium ⓘHigher in Selenium content than 98% of foods
Chia seeds calories (kcal)
| Calories for different serving sizes of chia seeds | Calories | Weight |
|---|---|---|
| Calories in 100 grams | 486 | |
| Calories in 1 oz | 138 | 28.35 g |
| Calories for different varieties of chia seeds | Calories | Weight |
|---|---|---|
| Seeds, chia seeds, dried (this food) | 486 | 100 g |
| Seeds, breadfruit seeds, boiled | 168 | 100 g |
| Seeds, breadfruit seeds, raw | 191 | 100 g |
| Seeds, breadfruit seeds, roasted | 207 | 100 g |
| Seeds, breadnut tree seeds, raw | 217 | 100 g |
| Seeds, cottonseed flour, low fat (glandless) | 332 | 100 g |
| Seeds, cottonseed flour, partially defatted (glandless) | 359 | 100 g |
| Seeds, breadnut tree seeds, dried | 367 | 100 g |
| Seeds, cottonseed meal, partially defatted (glandless) | 367 | 100 g |
| Seeds, cottonseed kernels, roasted (glandless) | 506 | 100 g |
Extra Nutrition facts for Chia seeds
| Protein per 100 calories ⓘ Shows how many grams of protein you get from 100 calories of this food, calculated as (protein in g ÷ calories) × 100. | 3.4 g |
| Calories per 10 g protein ⓘ Shows how many calories you need to eat from this food to get 10 g of protein, calculated as (calories ÷ protein in g) × 10. | 294 kcal |
| Weight per 100 calories ⓘ Shows how many grams of this food equal 100 kcal—higher grams mean a larger portion for the same calories. | 21 g |
| Campesterol ⓘ https://fdc.nal.usda.gov/food-details/170182/nutrients | 14.6 mg ⓘ https://www.researchgate.net/publication/37158781 |
| Beta-sitosterol ⓘ Beta-sitosterol is a naturally occurring plant sterol (phytosterol) that is structurally similar to cholesterol. It is found in various plant-based foods and is commonly used in supplements, primarily for lowering cholesterol levels and improving symptoms of an enlarged prostate (BPH). | 63.8 mg ⓘ https://www.researchgate.net/publication/37158781 |
| Acidity (Based on PRAL) ⓘ PRAL (Potential renal acid load) is calculated using a formula. On the PRAL scale the higher the positive value, the more is the acidifying effect on the body. The lower the negative value, the higher the alkalinity of the food. 0 is neutral. | 14.5 (acidic) |
| Chlorogenic acid | 5 mg ⓘ https://www.sciencedirect.com/science/article/pii/S1756464623000804 |
| Ferulic acid | 1.7 mcg ⓘ https://www.sciencedirect.com/science/article/pii/S1756464623000804 |
| Caffeic acid | 5.9 mcg ⓘ https://www.sciencedirect.com/science/article/pii/S1756464623000804 |
| Rosmarinic acid | 74 mg ⓘ https://www.sciencedirect.com/science/article/pii/S1756464623000804 |
| p-Coumaric acid | 1.2 mg ⓘ https://www.sciencedirect.com/science/article/pii/S1756464623000804 |
| Gallic acid | 6 mg ⓘ https://www.sciencedirect.com/science/article/pii/S1756464623000804 |
| Stigmasterol | 38.7 mg ⓘ https://www.researchgate.net/publication/37158781 |
| Processing score ⓘ The processing score is a calculated value that looks at both how industrially made it is (NOVA) and how healthy/unprocessed the ingredients are (SIGA), then combines them into one score from 1 (least processed) to 4 (most processed). | 1 - Unprocessed ⓘ NOVA score = 1, SIGA score = A0 |
Chia seeds Glycemic index (GI)
Gi values are taken from various scientific sources. GI values less than 55 are considered as low. Values above 70 are considered as high.
Mineral coverage chart
Mineral chart - relative view
Vitamin coverage chart
Vitamin A:
0µg of 900µg
0%
Vitamin E:
1.5mg of 15mg
10%
Vitamin D:
0µg of 20µg
0%
Vitamin C:
4.8mg of 90mg
5.3%
Vitamin B1:
1.9mg of 1mg
155%
Vitamin B2:
0.51mg of 1mg
39%
Vitamin B3:
26mg of 16mg
166%
Vitamin B5:
0mg of 5mg
0%
Vitamin B6:
0mg of 1mg
0%
Folate:
147µg of 400µg
37%
Vitamin B12:
0µg of 2µg
0%
Vitamin K:
0µg of 120µg
0%
Vitamin chart - relative view
Macronutrients chart
Protein:
Daily Value: 33%
16.5 g of 50 g
16.5 g (33% of DV )
Fats:
Daily Value: 47%
30.7 g of 65 g
30.7 g (47% of DV )
Carbs:
Daily Value: 14%
42.1 g of 300 g
42.1 g (14% of DV )
Water:
Daily Value: 0%
5.8 g of 2,000 g
5.8 g (0% of DV )
Other:
4.8 g
4.8 g
Protein quality breakdown
Tryptophan:
1308mg of 280mg
467%
Threonine:
2127mg of 1,050mg
203%
Isoleucine:
2403mg of 1,400mg
172%
Leucine:
4113mg of 2,730mg
151%
Lysine:
2910mg of 2,100mg
139%
Methionine:
1764mg of 1,050mg
168%
Phenylalanine:
3048mg of 1,750mg
174%
Valine:
2850mg of 1,820mg
157%
Histidine:
1593mg of 700mg
228%
Fat type information
Saturated fat:
3.3 g
Monounsaturated fat:
2.3 g
Polyunsaturated fat:
24 g
Fiber content ratio for Chia seeds
Sugar:
0 g
Fiber:
34 g
Other:
7.7 g
All nutrients for Chia seeds per 100g
| Nutrient | Value | DV% | In TOP % of foods | Comparison |
| Calories | 486kcal | 24% | 8% |
10.3 times more than Orange
|
| Protein per 100 calories | 3.4g | N/A | 57% | |
| Calories per 10 g protein | 294kcal | N/A | 40% | |
| Weight per 100 calories | 21g | N/A | 93% | |
| Protein | 17g | 39% | 32% |
5.9 times more than Broccoli
|
| Fats | 31g | 47% | 7% |
1.1 times less than Cheese
|
| Unsaturated / Saturated Fat ratio | 7.8 | N/A | 4% | |
| Vitamin C | 1.6mg | 2% | 29% |
33.1 times less than Lemon
|
| Carbs | 42g | 14% | 24% |
1.5 times more than Rice
|
| Net carbs | 7.7g | N/A | 51% |
7 times less than Chocolate
|
| Cholesterol | 0mg | 0% | 100% |
N/A
|
| Magnesium | 335mg | 80% | 1% |
2.4 times more than Almonds
|
| Calcium | 631mg | 63% | 2% |
5 times more than Milk
|
| Potassium | 407mg | 12% | 13% |
2.8 times more than Cucumber
|
| Iron | 7.7mg | 97% | 6% |
3 times more than Beef broiled
|
| Fiber | 34g | 138% | 1% |
14.3 times more than Orange
|
| Copper | 0.92mg | 103% | 3% |
6.5 times more than Shiitake
|
| Zinc | 4.6mg | 42% | 13% |
1.4 times less than Beef broiled
|
| Phosphorus | 860mg | 123% | 1% |
4.7 times more than Chicken meat
|
| Sodium | 16mg | 1% | 82% |
30.6 times less than White bread
|
| Vitamin E | 0.5mg | 3% | 25% |
2.9 times less than Kiwi
|
| Manganese | 2.7mg | 118% | 3% | |
| Selenium | 55µg | 100% | 2% | |
| Vitamin B1 | 0.62mg | 52% | 8% |
2.3 times more than Pea raw
|
| Vitamin B2 | 0.17mg | 13% | 47% |
1.3 times more than Avocado
|
| Vitamin B3 | 8.8mg | 55% | 7% |
1.1 times less than Turkey meat
|
| Vitamin B12 | 0µg | 0% | 100% |
N/A
|
| Folate | 49µg | 12% | 21% |
1.2 times less than Brussels sprouts
|
| Trans fat | 0.14g | N/A | 18% |
106.4 times less than Margarine
|
| Saturated fat | 3.3g | 17% | 31% |
1.8 times less than Beef broiled
|
| Monounsaturated fat | 2.3g | N/A | 43% |
4.2 times less than Avocado
|
| Polyunsaturated fat | 24g | N/A | 2% |
2 times less than Walnut
|
| Tryptophan | 0.44mg | 0% | 1% |
1.4 times more than Chicken meat
|
| Threonine | 0.71mg | 0% | 28% |
Equal to Beef broiled
|
| Isoleucine | 0.8mg | 0% | 26% |
1.1 times less than Salmon raw
|
| Leucine | 1.4mg | 0% | 27% |
1.8 times less than Tuna Bluefin
|
| Lysine | 0.97mg | 0% | 31% |
2.1 times more than Tofu
|
| Methionine | 0.59mg | 0% | 18% |
6.1 times more than Quinoa
|
| Phenylalanine | 1mg | 0% | 13% |
1.5 times more than Egg
|
| Valine | 0.95mg | 0% | 24% |
2.1 times less than Soybean raw
|
| Histidine | 0.53mg | 0% | 26% |
1.4 times less than Turkey meat
|
| Omega-3 - ALA | 18g | N/A | 1% |
2 times more than Canola oil
|
| Omega-6 - Linoleic acid | 5.8g | N/A | 3% |
2.1 times less than Almonds
|
Check out similar food or compare with current
NUTRITION FACTS LABEL
Nutrition Facts
___servings per container
Serving Size ______________
Serving Size ______________
Amount Per 100g
Calories 486
% Daily Value*
47%
Total Fat
31g
15%
Saturated Fat 3.3g
0
Trans Fat
0g
0
Cholesterol 0mg
0.7%
Sodium 16mg
14%
Total Carbohydrate
42g
138%
Dietary Fiber
34g
Total Sugars 0g
Includes ? g Added Sugars
Protein
17g
Vitamin D
0mcg
0
Calcium
631mg
63%
Iron
7.7mg
97%
Potassium
407mg
12%
*
The % Daily Value (DV) tells you how much a nutrient in a serving of food contributes to a daily diet. 2,000 calories a day is used for general nutrition advice.
Health checks
ⓘ
Dietary cholesterol is not associated with an increased risk of coronary heart disease in healthy individuals. However, dietary cholesterol is common in foods that are high in harmful saturated fats.
Source
Low in Cholesterol
ⓘ
Trans fat consumption increases the risk of cardiovascular disease and mortality by negatively affecting blood lipid levels.
Source
No Trans Fats
ⓘ
Saturated fat intake can raise total cholesterol and LDL (low-density lipoprotein) levels, leading to an increased risk of atherosclerosis. Dietary guidelines recommend limiting saturated fats to under 10% of calories a day.
Source
Low in Saturated Fats
ⓘ
While the consumption of moderate amounts of added sugars is not detrimental to health, an excessive intake can increase the risk of obesity, and therefore, diabetes.
Source
Low in Sugars
Chia seeds nutrition infographic
Infographic link
References
All the values for which the sources are not specified explicitly are taken from FDA’s Food Central. The exact link to the food presented on this page can be found below.