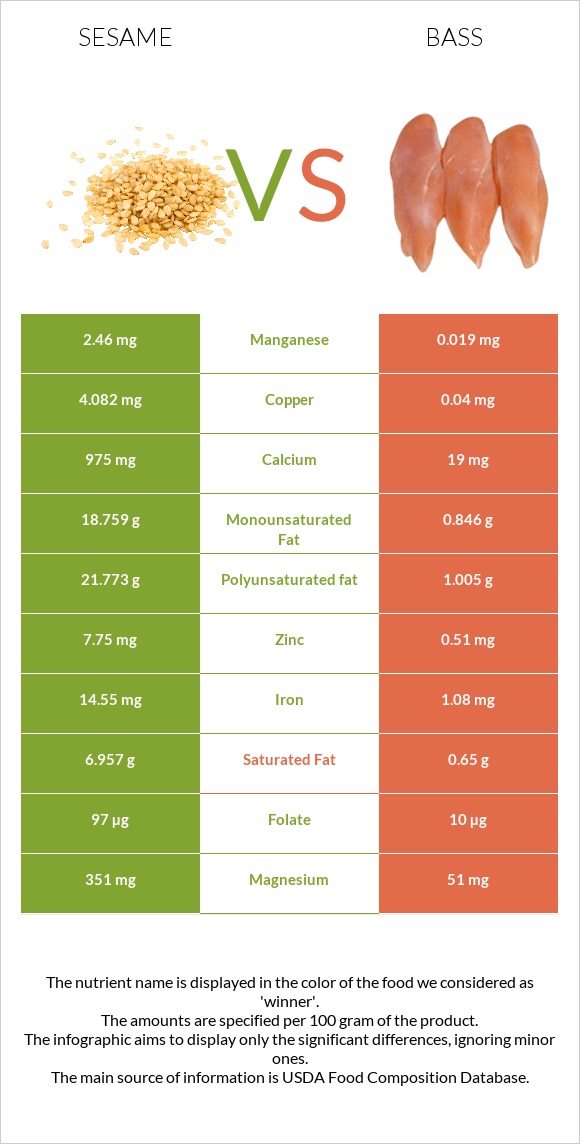
Differences between sesame and sea bass Sesame has more copper, iron, manganese, calcium, magnesium, zinc, vitamin B1, phosphorus, and fiber, while sea bass has more vitamin B12. Sesame's daily need coverage for copper is 449% higher. The food types used in this comparison are Seeds, sesame seeds, whole, dried and Fish, bass, striped, cooked, dry heat .
Infographic
Mineral Comparison
Mineral comparison score is based on the number of minerals by which one or the other food is richer. The "coverage" charts below show how much of the daily needs can be covered by 300 grams of the food.
9
100 g
300 g
1 tbsp - 9g 1 cup - 144g
Magnesium
Magnesium
Calcium
Calcium
Potassium
Potassium
Iron
Iron
Copper
Copper
Zinc
Zinc
Phosphorus
Phosphorus
Sodium
Sodium
Manganese
Manganese
Selenium
Selenium
251%
293%
41%
546%
1361%
211%
270%
1.4%
321%
188%
1
100 g
300 g
3 oz - 85g 1 fillet - 124g
Magnesium
Magnesium
Calcium
Calcium
Potassium
Potassium
Iron
Iron
Copper
Copper
Zinc
Zinc
Phosphorus
Phosphorus
Sodium
Sodium
Manganese
Manganese
Selenium
Selenium
36%
5.7%
29%
41%
13%
14%
109%
11%
2.5%
255%
Vitamin Comparison
Vitamin comparison score is based on the number of vitamins by which one or the other food is richer. The "coverage" charts below show how much of the daily needs can be covered by 300 grams of the food.
6
100 g
300 g
1 tbsp - 9g 1 cup - 144g
Vitamin C
Vit. C
Vitamin D
Vit. D
Vitamin A
Vit. A
Vitamin E
Vit. E
Vitamin B1
Vit. B1
Vitamin B2
Vit. B2
Vitamin B3
Vit. B3
Vitamin B5
Vit. B5
Vitamin B6
Vit. B6
Vitamin B12
Vit. B12
Vitamin K
Vit. K
Folate
Folate
0%
0%
0%
5%
198%
57%
85%
3%
182%
0%
0%
73%
3
100 g
300 g
3 oz - 85g 1 fillet - 124g
Vitamin C
Vit. C
Vitamin D
Vit. D
Vitamin A
Vit. A
Vitamin E
Vit. E
Vitamin B1
Vit. B1
Vitamin B2
Vit. B2
Vitamin B3
Vit. B3
Vitamin B5
Vit. B5
Vitamin B6
Vit. B6
Vitamin B12
Vit. B12
Vitamin K
Vit. K
Folate
Folate
0%
0%
10%
0%
29%
8.5%
48%
52%
80%
551%
0%
7.5%
All nutrients comparison - raw data values
Nutrient
DV% diff.
Copper
4.082mg
0.04mg
449%
Vitamin B12
0µg
4.41µg
184%
Iron
14.55mg
1.08mg
168%
Polyunsaturated fat
21.773g
1.005g
138%
Manganese
2.46mg
0.019mg
106%
Calcium
975mg
19mg
96%
Fats
49.67g
2.99g
72%
Magnesium
351mg
51mg
71%
Zinc
7.75mg
0.51mg
66%
Vitamin B1
0.791mg
0.115mg
56%
Phosphorus
629mg
254mg
54%
Fiber
11.8g
0g
47%
Monounsaturated fat
18.759g
0.846g
45%
Cholesterol
0mg
103mg
34%
Vitamin B6
0.79mg
0.346mg
34%
Saturated fat
6.957g
0.65g
29%
Selenium
34.4µg
46.8µg
23%
Calories
573kcal
124kcal
22%
Folate
97µg
10µg
22%
Vitamin B2
0.247mg
0.037mg
16%
Vitamin B5
0.05mg
0.865mg
16%
Vitamin B3
4.515mg
2.558mg
12%
Protein
17.73g
22.73g
10%
Carbs
23.45g
0g
8%
Choline
25.6mg
5%
Potassium
468mg
328mg
4%
Sodium
11mg
88mg
3%
Vitamin A
0µg
31µg
3%
Vitamin E
0.25mg
2%
Protein per 100 calories
3.1g
18g
N/A
Calories per 10 g protein
323kcal
55kcal
N/A
Weight per 100 calories
17g
81g
N/A
Unsaturated / Saturated Fat ratio
5.8
2.8
N/A
Net carbs
11.65g
0g
N/A
Sugar
0.3g
N/A
Tryptophan
0.388mg
0.255mg
0%
Threonine
0.736mg
0.997mg
0%
Isoleucine
0.763mg
1.047mg
0%
Leucine
1.358mg
1.848mg
0%
Lysine
0.569mg
2.088mg
0%
Methionine
0.586mg
0.673mg
0%
Phenylalanine
0.94mg
0.887mg
0%
Valine
0.99mg
1.171mg
0%
Histidine
0.522mg
0.669mg
0%
Omega-3 - EPA
0g
0.217g
N/A
Omega-3 - DHA
0g
0.75g
N/A
Macronutrient Comparison
Macronutrient breakdown side-by-side comparison
3
18%
50%
23%
5%
4%
Protein:
17.73 g
Fats:
49.67 g
Carbs:
23.45 g
Water:
4.69 g
Other:
4.46 g
2
23%
3%
73%
Protein:
22.73 g
Fats:
2.99 g
Carbs:
0 g
Water:
73.36 g
Other:
0.92 g
Contains
more
Fats Fats
+1561.2%
Contains
more
Carbs Carbs
+∞%
Contains
more
Other Other
+384.8%
Contains
more
Protein Protein
+28.2%
Contains
more
Water Water
+1464.2%
Fat Type Comparison
Fat type breakdown side-by-side comparison
2
15%
40%
46%
Saturated fat:
Sat. Fat
6.957 g
Monounsaturated fat:
Mono. Fat
18.759 g
Polyunsaturated fat:
Poly. Fat
21.773 g
1
26%
34%
40%
Saturated fat:
Sat. Fat
0.65 g
Monounsaturated fat:
Mono. Fat
0.846 g
Polyunsaturated fat:
Poly. Fat
1.005 g
Contains
more
Mono. Fat Monounsaturated fat
+2117.4%
Contains
more
Poly. Fat Polyunsaturated fat
+2066.5%
Contains
less
Sat. Fat Saturated fat
-90.7%