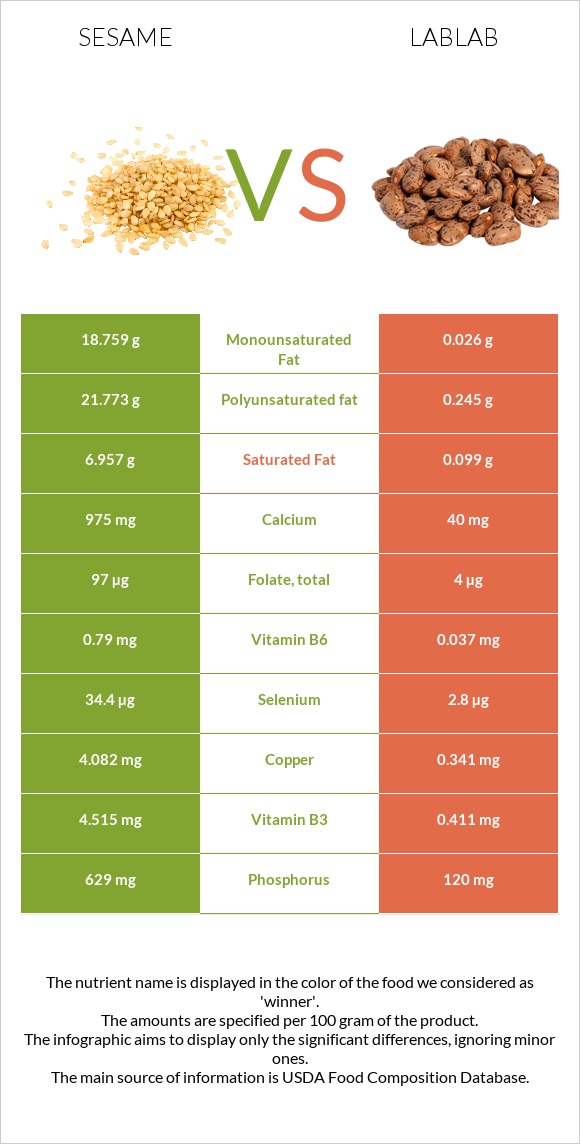
Differences between sesame and lablab Lablab contains less copper, iron, calcium, manganese, phosphorus, magnesium, vitamin B6, selenium, zinc, and vitamin B1 than sesame. Sesame's daily need coverage for copper is 416% higher. Lablab contains 24 times less calcium than sesame. Sesame contains 975mg of calcium, while lablab contains 40mg. The food types used in this comparison are Seeds, sesame seeds, whole, dried and Hyacinth beans, mature seeds, cooked, boiled, without salt .
Infographic
Mineral Comparison
Mineral comparison score is based on the number of minerals by which one or the other food is richer. The "coverage" charts below show how much of the daily needs can be covered by 300 grams of the food.
9
100 g
300 g
1 tbsp - 9g 1 cup - 144g
Magnesium
Magnesium
Calcium
Calcium
Potassium
Potassium
Iron
Iron
Copper
Copper
Zinc
Zinc
Phosphorus
Phosphorus
Sodium
Sodium
Manganese
Manganese
Selenium
Selenium
251%
293%
41%
546%
1361%
211%
270%
1.4%
321%
188%
1
100 g
300 g
1 cup - 194g
Magnesium
Magnesium
Calcium
Calcium
Potassium
Potassium
Iron
Iron
Copper
Copper
Zinc
Zinc
Phosphorus
Phosphorus
Sodium
Sodium
Manganese
Manganese
Selenium
Selenium
59%
12%
30%
172%
114%
78%
51%
0.91%
63%
15%
Vitamin Comparison
Vitamin comparison score is based on the number of vitamins by which one or the other food is richer. The "coverage" charts below show how much of the daily needs can be covered by 300 grams of the food.
6
100 g
300 g
1 tbsp - 9g 1 cup - 144g
Vitamin C
Vit. C
Vitamin D
Vit. D
Vitamin A
Vit. A
Vitamin E
Vit. E
Vitamin B1
Vit. B1
Vitamin B2
Vit. B2
Vitamin B3
Vit. B3
Vitamin B5
Vit. B5
Vitamin B6
Vit. B6
Vitamin B12
Vit. B12
Vitamin K
Vit. K
Folate
Folate
0%
0%
0%
5%
198%
57%
85%
3%
182%
0%
0%
73%
1
100 g
300 g
1 cup - 194g
Vitamin C
Vit. C
Vitamin D
Vit. D
Vitamin A
Vit. A
Vitamin E
Vit. E
Vitamin B1
Vit. B1
Vitamin B2
Vit. B2
Vitamin B3
Vit. B3
Vitamin B5
Vit. B5
Vitamin B6
Vit. B6
Vitamin B12
Vit. B12
Vitamin K
Vit. K
Folate
Folate
0%
0%
0%
0%
68%
8.5%
7.7%
19%
8.5%
0%
0%
3%
All nutrients comparison - raw data values
Nutrient
DV% diff.
Copper
4.082mg
0.341mg
416%
Polyunsaturated fat
21.773g
0.245g
144%
Iron
14.55mg
4.58mg
125%
Calcium
975mg
40mg
94%
Manganese
2.46mg
0.482mg
86%
Fats
49.67g
0.58g
76%
Phosphorus
629mg
120mg
73%
Magnesium
351mg
82mg
64%
Vitamin B6
0.79mg
0.037mg
58%
Selenium
34.4µg
2.8µg
57%
Fiber
11.8g
47%
Monounsaturated fat
18.759g
0.026g
47%
Zinc
7.75mg
2.85mg
45%
Vitamin B1
0.791mg
0.27mg
43%
Saturated fat
6.957g
0.099g
31%
Vitamin B3
4.515mg
0.411mg
26%
Calories
573kcal
117kcal
23%
Folate
97µg
4µg
23%
Protein
17.73g
8.14g
19%
Vitamin B2
0.247mg
0.037mg
16%
Vitamin B5
0.05mg
0.316mg
5%
Choline
25.6mg
5%
Potassium
468mg
337mg
4%
Vitamin E
0.25mg
2%
Carbs
23.45g
20.69g
1%
Protein per 100 calories
3.1g
7g
N/A
Calories per 10 g protein
323kcal
144kcal
N/A
Weight per 100 calories
17g
85g
N/A
Unsaturated / Saturated Fat ratio
5.8
2.7
N/A
Net carbs
11.65g
20.69g
N/A
Sugar
0.3g
N/A
Sodium
11mg
7mg
0%
Tryptophan
0.388mg
0.068mg
0%
Threonine
0.736mg
0.315mg
0%
Isoleucine
0.763mg
0.39mg
0%
Leucine
1.358mg
0.691mg
0%
Lysine
0.569mg
0.556mg
0%
Methionine
0.586mg
0.065mg
0%
Phenylalanine
0.94mg
0.41mg
0%
Valine
0.99mg
0.422mg
0%
Histidine
0.522mg
0.233mg
0%
Macronutrient Comparison
Macronutrient breakdown side-by-side comparison
4
18%
50%
23%
5%
4%
Protein:
17.73 g
Fats:
49.67 g
Carbs:
23.45 g
Water:
4.69 g
Other:
4.46 g
1
8%
21%
69%
Protein:
8.14 g
Fats:
0.58 g
Carbs:
20.69 g
Water:
69.13 g
Other:
1.46 g
Contains
more
Protein Protein
+117.8%
Contains
more
Fats Fats
+8463.8%
Contains
more
Carbs Carbs
+13.3%
Contains
more
Other Other
+205.5%
Contains
more
Water Water
+1374%
Fat Type Comparison
Fat type breakdown side-by-side comparison
2
15%
40%
46%
Saturated fat:
Sat. Fat
6.957 g
Monounsaturated fat:
Mono. Fat
18.759 g
Polyunsaturated fat:
Poly. Fat
21.773 g
1
27%
7%
66%
Saturated fat:
Sat. Fat
0.099 g
Monounsaturated fat:
Mono. Fat
0.026 g
Polyunsaturated fat:
Poly. Fat
0.245 g
Contains
more
Mono. Fat Monounsaturated fat
+72050%
Contains
more
Poly. Fat Polyunsaturated fat
+8786.9%
Contains
less
Sat. Fat Saturated fat
-98.6%