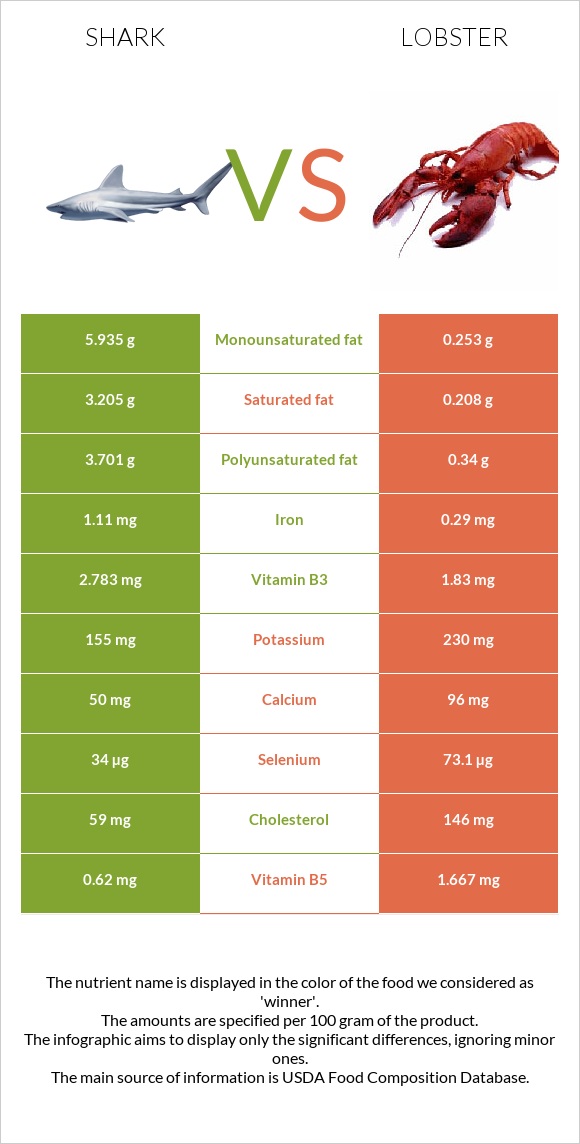
The main differences between shark and lobster Shark is richer in vitamin B6 and iron, yet lobster is richer in copper, selenium, zinc, vitamin B5, and vitamin B12. Daily need coverage for copper for lobster is 168% higher. Shark contains 15 times more saturated fat than lobster. Shark contains 3.205g of saturated fat, while lobster contains 0.208g. Food types used in this article are Fish, shark, mixed species, cooked, batter-dipped and fried and Crustaceans, lobster, northern, cooked, moist heat .
Infographic
Mineral Comparison
Mineral comparison score is based on the number of minerals by which one or the other food is richer. The "coverage" charts below show how much of the daily needs can be covered by 300 grams of the food.
2
100 g
300 g
3 oz - 85g
Magnesium
Magnesium
Calcium
Calcium
Potassium
Potassium
Iron
Iron
Copper
Copper
Zinc
Zinc
Phosphorus
Phosphorus
Sodium
Sodium
Manganese
Manganese
Selenium
Selenium
31%
15%
14%
42%
14%
13%
83%
16%
6.5%
185%
6
100 g
300 g
3 oz - 85g 1 cup - 145g
Magnesium
Magnesium
Calcium
Calcium
Potassium
Potassium
Iron
Iron
Copper
Copper
Zinc
Zinc
Phosphorus
Phosphorus
Sodium
Sodium
Manganese
Manganese
Selenium
Selenium
31%
29%
20%
11%
517%
110%
79%
63%
8.5%
399%
Vitamin Comparison
Vitamin comparison score is based on the number of vitamins by which one or the other food is richer. The "coverage" charts below show how much of the daily needs can be covered by 300 grams of the food.
6
100 g
300 g
3 oz - 85g
Vitamin C
Vit. C
Vitamin D
Vit. D
Vitamin A
Vit. A
Vitamin E
Vit. E
Vitamin B1
Vit. B1
Vitamin B2
Vit. B2
Vitamin B3
Vit. B3
Vitamin B5
Vit. B5
Vitamin B6
Vit. B6
Vitamin B12
Vit. B12
Vitamin K
Vit. K
Folate
Folate
0%
0%
18%
0%
18%
22%
52%
37%
69%
151%
0%
11%
3
100 g
300 g
3 oz - 85g 1 cup - 145g
Vitamin C
Vit. C
Vitamin D
Vit. D
Vitamin A
Vit. A
Vitamin E
Vit. E
Vitamin B1
Vit. B1
Vitamin B2
Vit. B2
Vitamin B3
Vit. B3
Vitamin B5
Vit. B5
Vitamin B6
Vit. B6
Vitamin B12
Vit. B12
Vitamin K
Vit. K
Folate
Folate
0%
0%
0.33%
20%
5.8%
3.9%
34%
100%
27%
179%
0%
8.3%
All nutrients comparison - raw data values
Nutrient
DV% diff.
Copper
0.042mg
1.55mg
168%
Selenium
34µg
73.1µg
71%
Zinc
0.48mg
4.05mg
32%
Cholesterol
59mg
146mg
29%
Polyunsaturated fat
3.701g
0.34g
22%
Vitamin B5
0.62mg
1.667mg
21%
Fats
13.82g
0.86g
20%
Sodium
122mg
486mg
16%
Choline
80.9mg
15%
Vitamin B6
0.3mg
0.119mg
14%
Saturated fat
3.205g
0.208g
14%
Monounsaturated fat
5.935g
0.253g
14%
Iron
1.11mg
0.29mg
10%
Vitamin B12
1.21µg
1.43µg
9%
Calories
228kcal
89kcal
7%
Vitamin E
1mg
7%
Vitamin A
54µg
1µg
6%
Vitamin B2
0.097mg
0.017mg
6%
Vitamin B3
2.783mg
1.83mg
6%
Calcium
50mg
96mg
5%
Vitamin B1
0.072mg
0.023mg
4%
Carbs
6.39g
0g
2%
Potassium
155mg
230mg
2%
Protein
18.62g
19g
1%
Phosphorus
194mg
185mg
1%
Manganese
0.05mg
0.065mg
1%
Folate
15µg
11µg
1%
Protein per 100 calories
8.2g
21g
N/A
Calories per 10 g protein
122kcal
47kcal
N/A
Weight per 100 calories
44g
112g
N/A
Unsaturated / Saturated Fat ratio
3
2.9
N/A
Net carbs
6.39g
0g
N/A
Vitamin D*
1 IU
0%
Magnesium
43mg
43mg
0%
Trans fat
0.013g
N/A
Tryptophan
0.212mg
0.248mg
0%
Threonine
0.843mg
0.753mg
0%
Isoleucine
0.867mg
0.832mg
0%
Leucine
1.515mg
1.376mg
0%
Lysine
1.634mg
1.426mg
0%
Methionine
0.541mg
0.475mg
0%
Phenylalanine
0.75mg
0.782mg
0%
Valine
0.965mg
0.852mg
0%
Histidine
0.538mg
0.475mg
0%
Omega-3 - EPA
0.258g
0.117g
N/A
Omega-3 - DHA
0.431g
0.078g
N/A
Omega-3 - ALA
0.05g
N/A
Omega-3 - DPA
0.089g
0.006g
N/A
Omega-3 - Eicosatrienoic acid
0.006g
N/A
Omega-6 - Dihomo-gamma-linoleic acid
0.006g
N/A
Omega-6 - Eicosadienoic acid
0.006g
N/A
Omega-6 - Linoleic acid
0.033g
N/A
Macronutrient Comparison
Macronutrient breakdown side-by-side comparison
2
19%
14%
6%
60%
Protein:
18.62 g
Fats:
13.82 g
Carbs:
6.39 g
Water:
60.09 g
Other:
1.08 g
3
19%
78%
2%
Protein:
19 g
Fats:
0.86 g
Carbs:
0 g
Water:
78.11 g
Other:
2.03 g
Contains
more
Fats Fats
+1507%
Contains
more
Carbs Carbs
+∞%
Contains
more
Water Water
+30%
Contains
more
Other Other
+88%
Fat Type Comparison
Fat type breakdown side-by-side comparison
2
25%
46%
29%
Saturated fat:
Sat. Fat
3.205 g
Monounsaturated fat:
Mono. Fat
5.935 g
Polyunsaturated fat:
Poly. Fat
3.701 g
1
26%
32%
42%
Saturated fat:
Sat. Fat
0.208 g
Monounsaturated fat:
Mono. Fat
0.253 g
Polyunsaturated fat:
Poly. Fat
0.34 g
Contains
more
Mono. Fat Monounsaturated fat
+2245.8%
Contains
more
Poly. Fat Polyunsaturated fat
+988.5%
Contains
less
Sat. Fat Saturated fat
-93.5%