A recap on the differences between shark and oysters Shark is higher in vitamin B6, yet oysters is higher in zinc, vitamin B12, copper, iron, manganese, selenium, and calcium. Oysters covers your daily zinc needs 710% more than shark. Shark contains 5 times more vitamin B6 than oysters. While shark contains 0.3mg of vitamin B6, oysters contains only 0.061mg. The amount of saturated fat in oysters is lower. Food varieties used in this article are Fish, shark, mixed species, cooked, batter-dipped and fried and Mollusks, oyster, eastern, wild, cooked, moist heat .
Infographic
Mineral Comparison
Mineral comparison score is based on the number of minerals by which one or the other food is richer. The "coverage" charts below show how much of the daily needs can be covered by 300 grams of the food.
3
100 g
300 g
3 oz - 85g
Magnesium
Magnesium
Calcium
Calcium
Potassium
Potassium
Iron
Iron
Copper
Copper
Zinc
Zinc
Phosphorus
Phosphorus
Sodium
Sodium
Manganese
Manganese
Selenium
Selenium
31%
15%
14%
42%
14%
13%
83%
16%
6.5%
185%
6
100 g
300 g
6 medium - 42g 3 oz - 85g
Magnesium
Magnesium
Calcium
Calcium
Potassium
Potassium
Iron
Iron
Copper
Copper
Zinc
Zinc
Phosphorus
Phosphorus
Sodium
Sodium
Manganese
Manganese
Selenium
Selenium
25%
35%
12%
345%
1902%
2144%
83%
22%
77%
215%
Vitamin Comparison
Vitamin comparison score is based on the number of vitamins by which one or the other food is richer. The "coverage" charts below show how much of the daily needs can be covered by 300 grams of the food.
5
100 g
300 g
3 oz - 85g
Vitamin C
Vit. C
Vitamin D
Vit. D
Vitamin A
Vit. A
Vitamin E
Vit. E
Vitamin B1
Vit. B1
Vitamin B2
Vit. B2
Vitamin B3
Vit. B3
Vitamin B5
Vit. B5
Vitamin B6
Vit. B6
Vitamin B12
Vit. B12
Vitamin K
Vit. K
Folate
Folate
0%
0%
18%
0%
18%
22%
52%
37%
69%
151%
0%
11%
4
100 g
300 g
6 medium - 42g 3 oz - 85g
Vitamin C
Vit. C
Vitamin D
Vit. D
Vitamin A
Vit. A
Vitamin E
Vit. E
Vitamin B1
Vit. B1
Vitamin B2
Vit. B2
Vitamin B3
Vit. B3
Vitamin B5
Vit. B5
Vitamin B6
Vit. B6
Vitamin B12
Vit. B12
Vitamin K
Vit. K
Folate
Folate
0%
0%
8.7%
34%
9%
42%
35%
27%
14%
2188%
5%
11%
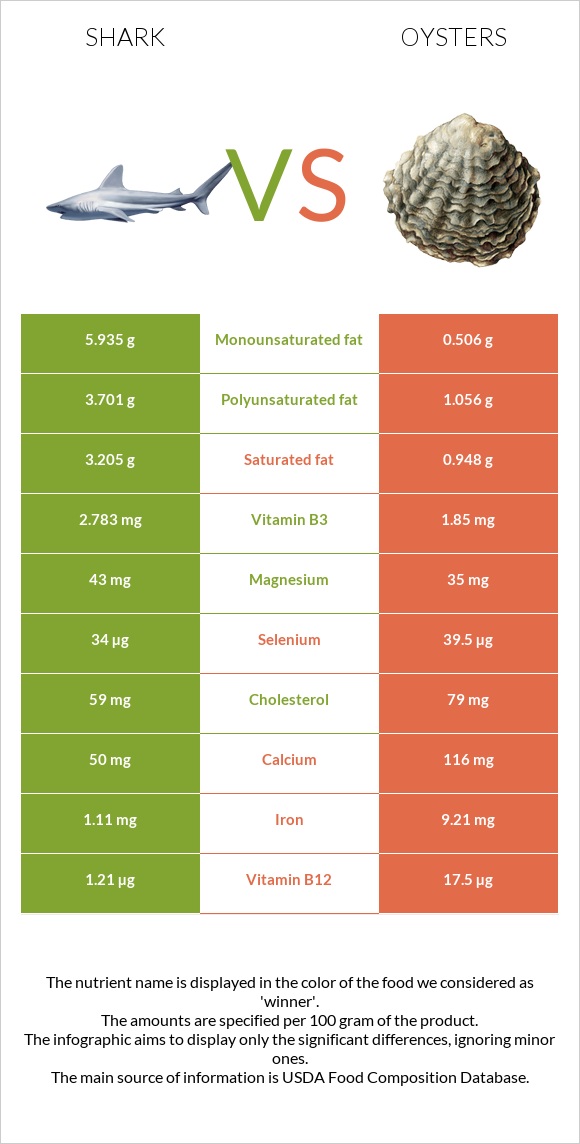
All nutrients comparison - raw data values
Nutrient
DV% diff.
Zinc
0.48mg
78.6mg
710%
Vitamin B12
1.21µg
17.5µg
679%
Copper
0.042mg
5.707mg
629%
Iron
1.11mg
9.21mg
101%
Manganese
0.05mg
0.591mg
24%
Choline
130mg
24%
Vitamin B6
0.3mg
0.061mg
18%
Polyunsaturated fat
3.701g
1.056g
18%
Fats
13.82g
3.42g
16%
Protein
18.62g
11.42g
14%
Monounsaturated fat
5.935g
0.506g
14%
Vitamin E
1.7mg
11%
Selenium
34µg
39.5µg
10%
Saturated fat
3.205g
0.948g
10%
Cholesterol
59mg
79mg
7%
Calcium
50mg
116mg
7%
Calories
228kcal
102kcal
6%
Vitamin B2
0.097mg
0.18mg
6%
Vitamin B3
2.783mg
1.85mg
6%
Vitamin A
54µg
26µg
3%
Vitamin B1
0.072mg
0.036mg
3%
Vitamin B5
0.62mg
0.447mg
3%
Magnesium
43mg
35mg
2%
Sodium
122mg
166mg
2%
Vitamin K
2µg
2%
Protein per 100 calories
8.2g
11g
N/A
Calories per 10 g protein
122kcal
89kcal
N/A
Weight per 100 calories
44g
98g
N/A
Unsaturated / Saturated Fat ratio
3
1.6
N/A
Net carbs
6.39g
5.45g
N/A
Carbs
6.39g
5.45g
0%
Vitamin D*
2 IU
0%
Potassium
155mg
139mg
0%
Sugar
1.23g
N/A
Starch
0.9g
0%
Phosphorus
194mg
194mg
0%
Folate
15µg
14µg
0%
Trans fat
0.068g
N/A
Tryptophan
0.212mg
0.138mg
0%
Threonine
0.843mg
0.046mg
0%
Isoleucine
0.867mg
0.459mg
0%
Leucine
1.515mg
0.716mg
0%
Lysine
1.634mg
0.762mg
0%
Methionine
0.541mg
0.257mg
0%
Phenylalanine
0.75mg
0.413mg
0%
Valine
0.965mg
0.523mg
0%
Histidine
0.538mg
0.22mg
0%
Omega-3 - EPA
0.258g
0.353g
N/A
Omega-3 - DHA
0.431g
0.271g
N/A
Omega-3 - ALA
0.163g
N/A
Omega-3 - DPA
0.089g
0.02g
N/A
Omega-3 - Eicosatrienoic acid
0.004g
N/A
Omega-6 - Gamma-linoleic acid
0.004g
N/A
Omega-6 - Dihomo-gamma-linoleic acid
0.007g
N/A
Omega-6 - Eicosadienoic acid
0.007g
N/A
Omega-6 - Linoleic acid
0.061g
N/A
Macronutrient Comparison
Macronutrient breakdown side-by-side comparison
3
19%
14%
6%
60%
Protein:
18.62 g
Fats:
13.82 g
Carbs:
6.39 g
Water:
60.09 g
Other:
1.08 g
2
11%
3%
5%
78%
Protein:
11.42 g
Fats:
3.42 g
Carbs:
5.45 g
Water:
78.19 g
Other:
1.52 g
Contains
more
Protein Protein
+63%
Contains
more
Fats Fats
+304.1%
Contains
more
Carbs Carbs
+17.2%
Contains
more
Water Water
+30.1%
Contains
more
Other Other
+40.7%
Fat Type Comparison
Fat type breakdown side-by-side comparison
2
25%
46%
29%
Saturated fat:
Sat. Fat
3.205 g
Monounsaturated fat:
Mono. Fat
5.935 g
Polyunsaturated fat:
Poly. Fat
3.701 g
1
38%
20%
42%
Saturated fat:
Sat. Fat
0.948 g
Monounsaturated fat:
Mono. Fat
0.506 g
Polyunsaturated fat:
Poly. Fat
1.056 g
Contains
more
Mono. Fat Monounsaturated fat
+1072.9%
Contains
more
Poly. Fat Polyunsaturated fat
+250.5%
Contains
less
Sat. Fat Saturated fat
-70.4%