Shortcake vs. Lemon meringue pie — In-Depth Nutrition Comparison
Compare
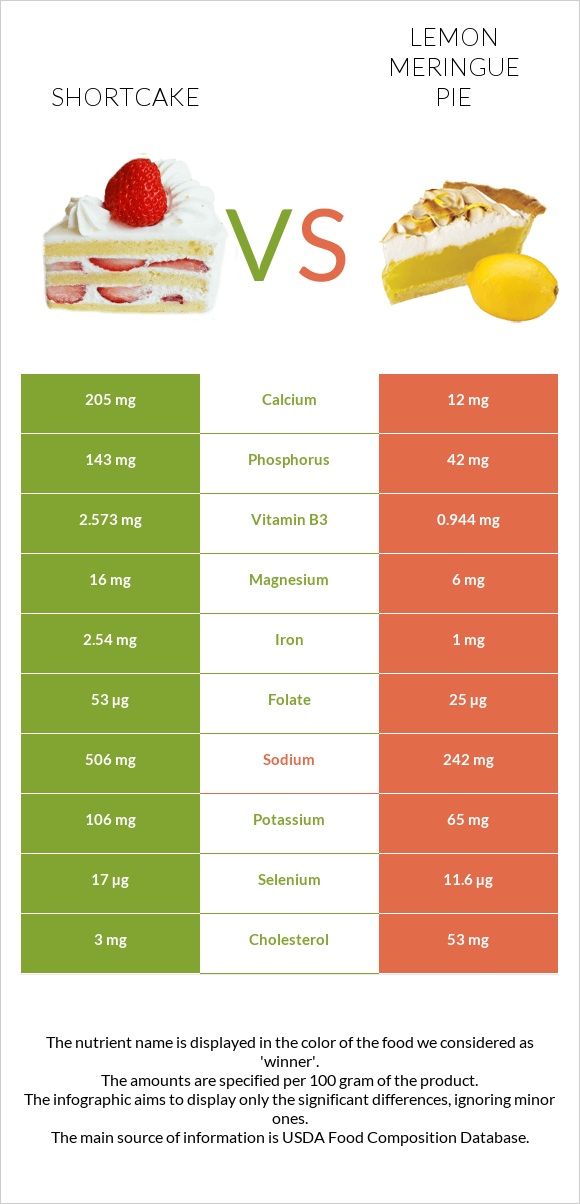
What are the differences between shortcake and lemon meringue pie?
- Shortcake is richer than lemon meringue pie in calcium, iron, vitamin B1, phosphorus, vitamin B3, selenium, manganese, and vitamin B2.
- Shortcake's daily need coverage for calcium is 19% more.
- Shortcake has 3 times more phosphorus than lemon meringue pie. While shortcake has 143mg of phosphorus, lemon meringue pie has only 42mg.
- The amount of sodium in lemon meringue pie is lower.
We used Cake, shortcake, biscuit-type, prepared from recipe and Pie, lemon meringue, prepared from recipe types in this article.
Infographic
Infographic link
Mineral Comparison
Mineral comparison score is based on the number of minerals by which one or the other food is richer. The "coverage" charts below show how much of the daily needs can be covered by 300 grams of the food.
| Contains more MagnesiumMagnesium | +166.7% |
| Contains more CalciumCalcium | +1608.3% |
| Contains more PotassiumPotassium | +63.1% |
| Contains more IronIron | +154% |
| Contains more CopperCopper | +81% |
| Contains more ZincZinc | +71.4% |
| Contains more PhosphorusPhosphorus | +240.5% |
| Contains more ManganeseManganese | +157.8% |
| Contains more SeleniumSelenium | +46.6% |
| Contains less SodiumSodium | -52.2% |
Vitamin Comparison
Vitamin comparison score is based on the number of vitamins by which one or the other food is richer. The "coverage" charts below show how much of the daily needs can be covered by 300 grams of the food.
| Contains more Vitamin B1Vitamin B1 | +163.6% |
| Contains more Vitamin B2Vitamin B2 | +71.1% |
| Contains more Vitamin B3Vitamin B3 | +172.6% |
| Contains more Vitamin B5Vitamin B5 | +15.9% |
| Contains more FolateFolate | +112% |
| Contains more Vitamin CVitamin C | +1550% |
| Contains more Vitamin AVitamin A | +138.9% |
| Contains more Vitamin B12Vitamin B12 | +71.4% |
All nutrients comparison - raw data values
| Nutrient |  |
 |
DV% diff. |
| Calcium | 205mg | 12mg | 19% |
| Iron | 2.54mg | 1mg | 19% |
| Cholesterol | 3mg | 53mg | 17% |
| Vitamin B1 | 0.311mg | 0.118mg | 16% |
| Phosphorus | 143mg | 42mg | 14% |
| Sodium | 506mg | 242mg | 11% |
| Selenium | 17µg | 11.6µg | 10% |
| Vitamin B3 | 2.573mg | 0.944mg | 10% |
| Manganese | 0.33mg | 0.128mg | 9% |
| Vitamin B2 | 0.272mg | 0.159mg | 9% |
| Folate | 53µg | 25µg | 7% |
| Protein | 6.1g | 3.8g | 5% |
| Copper | 0.076mg | 0.042mg | 4% |
| Calories | 346kcal | 285kcal | 3% |
| Vitamin C | 0.2mg | 3.3mg | 3% |
| Carbs | 48.5g | 39.1g | 3% |
| Vitamin A | 18µg | 43µg | 3% |
| Saturated fat | 3.772g | 3.185g | 3% |
| Fats | 14.2g | 12.9g | 2% |
| Magnesium | 16mg | 6mg | 2% |
| Zinc | 0.48mg | 0.28mg | 2% |
| Vitamin B12 | 0.07µg | 0.12µg | 2% |
| Polyunsaturated fat | 3.632g | 3.331g | 2% |
| Potassium | 106mg | 65mg | 1% |
| Vitamin B5 | 0.248mg | 0.214mg | 1% |
| Monounsaturated fat | 6.045g | 5.582g | 1% |
| Protein per 100 calories | 1.8g | 1.3g | N/A |
| Calories per 10 g protein | 567kcal | 750kcal | N/A |
| Weight per 100 calories | 29g | 35g | N/A |
| Unsaturated / Saturated Fat ratio | 2.6 | 2.8 | N/A |
| Net carbs | 48.5g | 39.1g | N/A |
| Vitamin B6 | 0.03mg | 0.027mg | 0% |
| Tryptophan | 0.076mg | 0.046mg | 0% |
| Threonine | 0.184mg | 0.143mg | 0% |
| Isoleucine | 0.238mg | 0.169mg | 0% |
| Leucine | 0.449mg | 0.292mg | 0% |
| Lysine | 0.197mg | 0.181mg | 0% |
| Methionine | 0.115mg | 0.092mg | 0% |
| Phenylalanine | 0.302mg | 0.194mg | 0% |
| Valine | 0.273mg | 0.192mg | 0% |
| Histidine | 0.14mg | 0.087mg | 0% |
| Omega-3 - DHA | 0g | 0.005g | N/A |
Macronutrient Comparison
Macronutrient breakdown side-by-side comparison
Protein:
6.1 g
Fats:
14.2 g
Carbs:
48.5 g
Water:
28.4 g
Other:
2.8 g
Protein:
3.8 g
Fats:
12.9 g
Carbs:
39.1 g
Water:
43.3 g
Other:
0.9 g
| Contains more ProteinProtein | +60.5% |
| Contains more CarbsCarbs | +24% |
| Contains more OtherOther | +211.1% |
| Contains more WaterWater | +52.5% |
~equal in
Fats
~12.9g
Fat Type Comparison
Fat type breakdown side-by-side comparison
Saturated fat:
Sat. Fat
3.772 g
Monounsaturated fat:
Mono. Fat
6.045 g
Polyunsaturated fat:
Poly. Fat
3.632 g
Saturated fat:
Sat. Fat
3.185 g
Monounsaturated fat:
Mono. Fat
5.582 g
Polyunsaturated fat:
Poly. Fat
3.331 g
| Contains less Sat. FatSaturated fat | -15.6% |
~equal in
Monounsaturated fat
~5.582g
~equal in
Polyunsaturated fat
~3.331g


