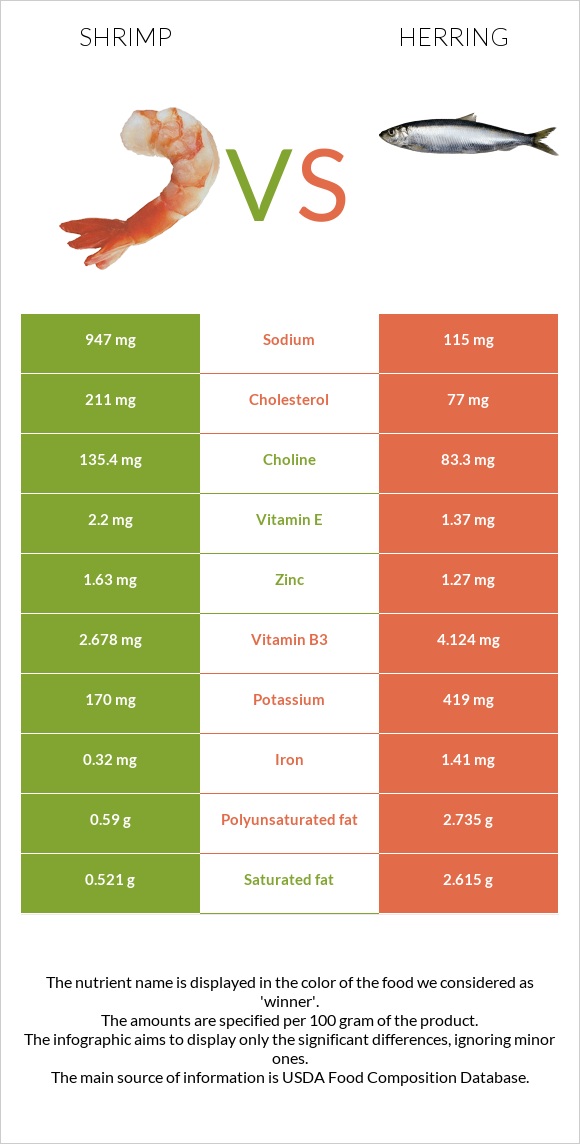
Differences between shrimp and herring Shrimp is higher in copper and choline; however, herring is richer in vitamin B12, vitamin D*, vitamin B2, iron, and vitamin B3. Herring's daily need coverage for vitamin B12 is 478% higher. Shrimp has 8 times more sodium than herring. While shrimp has 947mg of sodium, herring has only 115mg. Herring has a lower glycemic index (0) than shrimp (50). The food types used in this comparison are Crustaceans, shrimp, mixed species, cooked, moist heat (may have been previously frozen) and Fish, herring, Atlantic, cooked, dry heat .
Infographic
Mineral Comparison
Mineral comparison score is based on the number of minerals by which one or the other food is richer. The "coverage" charts below show how much of the daily needs can be covered by 300 grams of the food.
4
100 g
300 g
4 large - 22g 3 oz - 85g
Magnesium
Magnesium
Calcium
Calcium
Potassium
Potassium
Iron
Iron
Copper
Copper
Zinc
Zinc
Phosphorus
Phosphorus
Sodium
Sodium
Manganese
Manganese
Selenium
Selenium
26%
27%
15%
12%
86%
44%
131%
124%
6.4%
270%
4
100 g
300 g
3 oz - 85g 1 fillet - 143g
Magnesium
Magnesium
Calcium
Calcium
Potassium
Potassium
Iron
Iron
Copper
Copper
Zinc
Zinc
Phosphorus
Phosphorus
Sodium
Sodium
Manganese
Manganese
Selenium
Selenium
29%
22%
37%
53%
39%
35%
130%
15%
5.2%
255%
Vitamin Comparison
Vitamin comparison score is based on the number of vitamins by which one or the other food is richer. The "coverage" charts below show how much of the daily needs can be covered by 300 grams of the food.
4
100 g
300 g
4 large - 22g 3 oz - 85g
Vitamin C
Vit. C
Vitamin D
Vit. D
Vitamin A
Vit. A
Vitamin E
Vit. E
Vitamin B1
Vit. B1
Vitamin B2
Vit. B2
Vitamin B3
Vit. B3
Vitamin B5
Vit. B5
Vitamin B6
Vit. B6
Vitamin B12
Vit. B12
Vitamin K
Vit. K
Folate
Folate
0%
1.5%
30%
44%
8%
5.5%
50%
31%
56%
208%
1%
18%
8
100 g
300 g
3 oz - 85g 1 fillet - 143g
Vitamin C
Vit. C
Vitamin D
Vit. D
Vitamin A
Vit. A
Vitamin E
Vit. E
Vitamin B1
Vit. B1
Vitamin B2
Vit. B2
Vitamin B3
Vit. B3
Vitamin B5
Vit. B5
Vitamin B6
Vit. B6
Vitamin B12
Vit. B12
Vitamin K
Vit. K
Folate
Folate
2.3%
81%
12%
27%
28%
69%
77%
44%
80%
1643%
0.25%
9%
All nutrients comparison - raw data values
Nutrient
DV% diff.
Vitamin B12
1.66µg
13.14µg
478%
Cholesterol
211mg
77mg
45%
Sodium
947mg
115mg
36%
Vitamin D
0.1µg
5.4µg
27%
Vitamin D*
4 IU
214 IU
26%
Vitamin B2
0.024mg
0.299mg
21%
Copper
0.258mg
0.118mg
16%
Fats
1.7g
11.59g
15%
Iron
0.32mg
1.41mg
14%
Polyunsaturated fat
0.59g
2.735g
14%
Monounsaturated fat
0.361g
4.79g
11%
Saturated fat
0.521g
2.615g
10%
Vitamin B3
2.678mg
4.124mg
9%
Choline
135.4mg
83.3mg
9%
Vitamin B6
0.242mg
0.348mg
8%
Potassium
170mg
419mg
7%
Vitamin B1
0.032mg
0.112mg
7%
Vitamin A
90µg
36µg
6%
Vitamin E
2.2mg
1.37mg
6%
Selenium
49.5µg
46.8µg
5%
Calories
119kcal
203kcal
4%
Vitamin B5
0.519mg
0.74mg
4%
Zinc
1.63mg
1.27mg
3%
Folate
24µg
12µg
3%
Calcium
91mg
74mg
2%
Protein
22.78g
23.03g
1%
Vitamin C
0mg
0.7mg
1%
Carbs
1.52g
0g
1%
Magnesium
37mg
41mg
1%
Protein per 100 calories
19g
11g
N/A
Calories per 10 g protein
52kcal
88kcal
N/A
Weight per 100 calories
84g
49g
N/A
Unsaturated / Saturated Fat ratio
1.8
2.9
N/A
Net carbs
1.52g
0g
N/A
Phosphorus
306mg
303mg
0%
Manganese
0.049mg
0.04mg
0%
Vitamin K
0.4µg
0.1µg
0%
Trans fat
0.035g
N/A
Tryptophan
0.26mg
0.258mg
0%
Threonine
0.904mg
1.01mg
0%
Isoleucine
1.05mg
1.061mg
0%
Leucine
1.95mg
1.872mg
0%
Lysine
2.172mg
2.115mg
0%
Methionine
0.665mg
0.682mg
0%
Phenylalanine
0.992mg
0.899mg
0%
Valine
1.067mg
1.187mg
0%
Histidine
0.501mg
0.678mg
0%
Omega-3 - EPA
0.135g
0.909g
N/A
Omega-3 - DHA
0.141g
1.105g
N/A
Omega-3 - DPA
0.012g
0.071g
N/A
Omega-6 - Eicosadienoic acid
0.012g
N/A
Macronutrient Comparison
Macronutrient breakdown side-by-side comparison
3
23%
2%
72%
2%
Protein:
22.78 g
Fats:
1.7 g
Carbs:
1.52 g
Water:
71.56 g
Other:
2.44 g
2
23%
12%
64%
Protein:
23.03 g
Fats:
11.59 g
Carbs:
0 g
Water:
64.16 g
Other:
1.22 g
Contains
more
Carbs Carbs
+∞%
Contains
more
Water Water
+11.5%
Contains
more
Other Other
+100%
Contains
more
Fats Fats
+581.8%
~equal in
Protein
~23.03g
Fat Type Comparison
Fat type breakdown side-by-side comparison
1
35%
25%
40%
Saturated fat:
Sat. Fat
0.521 g
Monounsaturated fat:
Mono. Fat
0.361 g
Polyunsaturated fat:
Poly. Fat
0.59 g
2
26%
47%
27%
Saturated fat:
Sat. Fat
2.615 g
Monounsaturated fat:
Mono. Fat
4.79 g
Polyunsaturated fat:
Poly. Fat
2.735 g
Contains
less
Sat. Fat Saturated fat
-80.1%
Contains
more
Mono. Fat Monounsaturated fat
+1226.9%
Contains
more
Poly. Fat Polyunsaturated fat
+363.6%