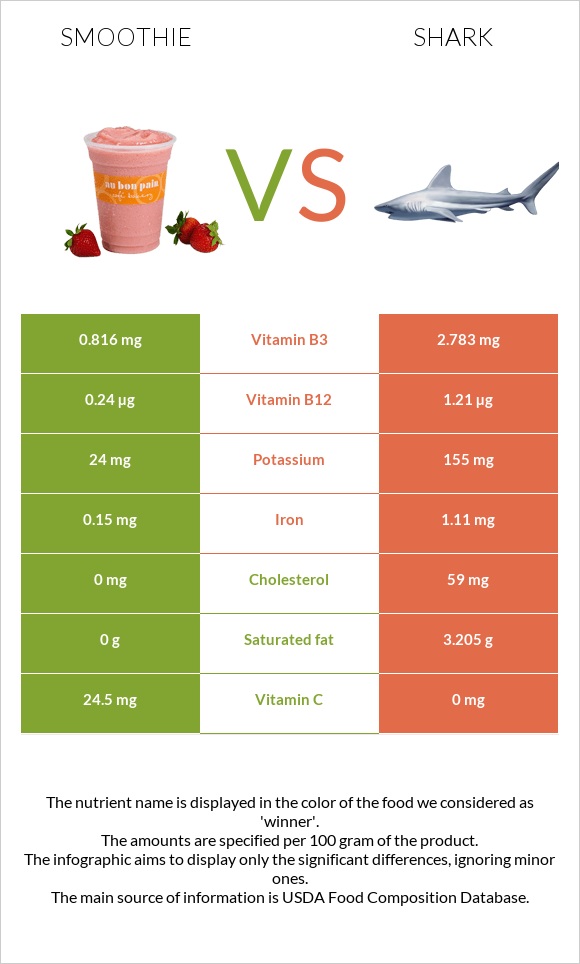
Summary of differences between smoothie and shark Smoothie has more vitamin C; however, shark is higher in vitamin B12, vitamin B6, vitamin B3, and iron. Shark covers your daily need for vitamin B12, 40% more than smoothie. The glycemic index of smoothie is higher. These are the specific foods used in this comparison Beverages, V8 SPLASH Smoothies, Strawberry Banana and Fish, shark, mixed species, cooked, batter-dipped and fried .
Infographic
Mineral Comparison
Mineral comparison score is based on the number of minerals by which one or the other food is richer. The "coverage" charts below show how much of the daily needs can be covered by 300 grams of the food.
1
100 g
300 g
1 serving 8 oz - 245g
Magnesium
Magnesium
Calcium
Calcium
Potassium
Potassium
Iron
Iron
Copper
Copper
Zinc
Zinc
Phosphorus
Phosphorus
Sodium
Sodium
Manganese
Manganese
Selenium
Selenium
0%
12%
2.1%
5.6%
0%
0%
0%
3.8%
0%
0%
9
100 g
300 g
3 oz - 85g
Magnesium
Magnesium
Calcium
Calcium
Potassium
Potassium
Iron
Iron
Copper
Copper
Zinc
Zinc
Phosphorus
Phosphorus
Sodium
Sodium
Manganese
Manganese
Selenium
Selenium
31%
15%
14%
42%
14%
13%
83%
16%
6.5%
185%
Vitamin Comparison
Vitamin comparison score is based on the number of vitamins by which one or the other food is richer. The "coverage" charts below show how much of the daily needs can be covered by 300 grams of the food.
1
100 g
300 g
1 serving 8 oz - 245g
Vitamin C
Vit. C
Vitamin D
Vit. D
Vitamin A
Vit. A
Vitamin E
Vit. E
Vitamin B1
Vit. B1
Vitamin B2
Vit. B2
Vitamin B3
Vit. B3
Vitamin B5
Vit. B5
Vitamin B6
Vit. B6
Vitamin B12
Vit. B12
Vitamin K
Vit. K
Folate
Folate
82%
0%
0%
0%
0%
0%
15%
0%
19%
30%
0%
0%
8
100 g
300 g
3 oz - 85g
Vitamin C
Vit. C
Vitamin D
Vit. D
Vitamin A
Vit. A
Vitamin E
Vit. E
Vitamin B1
Vit. B1
Vitamin B2
Vit. B2
Vitamin B3
Vit. B3
Vitamin B5
Vit. B5
Vitamin B6
Vit. B6
Vitamin B12
Vit. B12
Vitamin K
Vit. K
Folate
Folate
0%
0%
18%
0%
18%
22%
52%
37%
69%
151%
0%
11%
All nutrients comparison - raw data values
Nutrient
DV% diff.
Selenium
34µg
62%
Vitamin B12
0.24µg
1.21µg
40%
Protein
1.22g
18.62g
35%
Phosphorus
194mg
28%
Vitamin C
24.5mg
0mg
27%
Polyunsaturated fat
3.701g
25%
Fats
0g
13.82g
21%
Cholesterol
0mg
59mg
20%
Vitamin B6
0.082mg
0.3mg
17%
Saturated fat
0g
3.205g
15%
Monounsaturated fat
5.935g
15%
Iron
0.15mg
1.11mg
12%
Vitamin B3
0.816mg
2.783mg
12%
Vitamin B5
0.62mg
12%
Calories
37kcal
228kcal
10%
Magnesium
43mg
10%
Vitamin B2
0.097mg
7%
Vitamin A
54µg
6%
Vitamin B1
0.072mg
6%
Copper
0.042mg
5%
Potassium
24mg
155mg
4%
Zinc
0.48mg
4%
Sodium
29mg
122mg
4%
Folate
15µg
4%
Manganese
0.05mg
2%
Carbs
8.16g
6.39g
1%
Calcium
41mg
50mg
1%
Protein per 100 calories
3.3g
8.2g
N/A
Calories per 10 g protein
303kcal
122kcal
N/A
Weight per 100 calories
270g
44g
N/A
Unsaturated / Saturated Fat ratio
3
N/A
Net carbs
8.16g
6.39g
N/A
Sugar
7.35g
N/A
Tryptophan
0.212mg
0%
Threonine
0.843mg
0%
Isoleucine
0.867mg
0%
Leucine
1.515mg
0%
Lysine
1.634mg
0%
Methionine
0.541mg
0%
Phenylalanine
0.75mg
0%
Valine
0.965mg
0%
Histidine
0.538mg
0%
Omega-3 - EPA
0.258g
N/A
Omega-3 - DHA
0.431g
N/A
Omega-3 - DPA
0.089g
N/A
Macronutrient Comparison
Macronutrient breakdown side-by-side comparison
2
8%
90%
Protein:
1.22 g
Fats:
0 g
Carbs:
8.16 g
Water:
90.28 g
Other:
0.34 g
3
19%
14%
6%
60%
Protein:
18.62 g
Fats:
13.82 g
Carbs:
6.39 g
Water:
60.09 g
Other:
1.08 g
Contains
more
Carbs Carbs
+27.7%
Contains
more
Water Water
+50.2%
Contains
more
Protein Protein
+1426.2%
Contains
more
Fats Fats
+∞%
Contains
more
Other Other
+217.6%