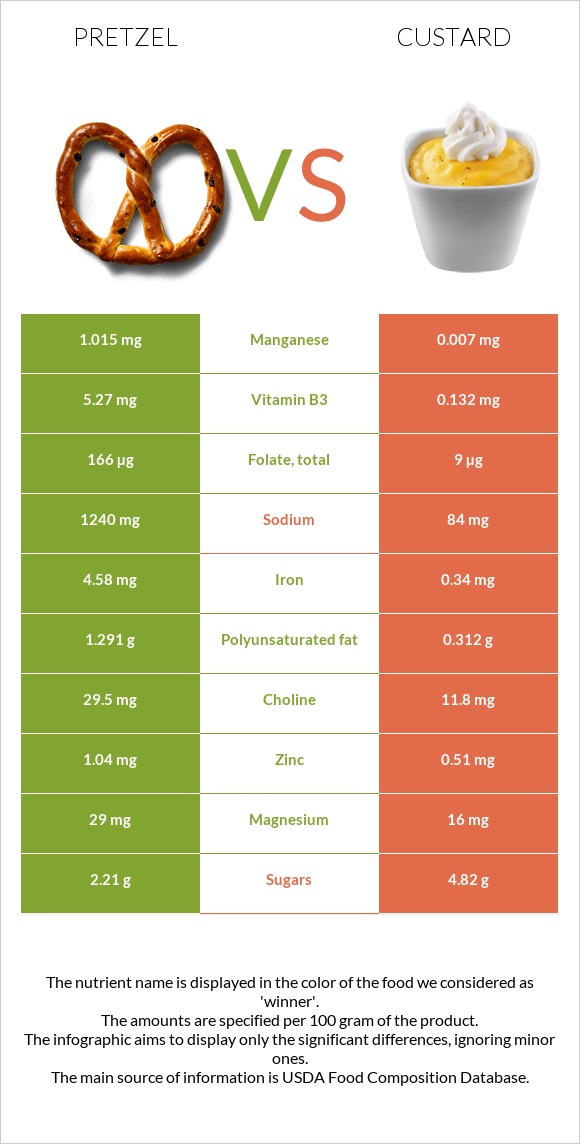
What are the differences between pretzel and custard? Pretzel is higher in iron, manganese, folate, vitamin B3, vitamin B1, copper, and fiber, yet custard is higher in vitamin B12. Pretzel's daily need coverage for iron is 53% more. The amount of sodium in custard is lower. The glycemic index of custard is lower. We used Snacks, pretzels, hard, plain, salted and Egg custards, dry mix, prepared with whole milk types in this article.
Infographic
Mineral Comparison
Mineral comparison score is based on the number of minerals by which one or the other food is richer. The "coverage" charts below show how much of the daily needs can be covered by 300 grams of the food.
5
100 g
300 g
1 oz - 28.35g 10 twists - 60g
Magnesium
Magnesium
Calcium
Calcium
Potassium
Potassium
Iron
Iron
Copper
Copper
Zinc
Zinc
Phosphorus
Phosphorus
Sodium
Sodium
Manganese
Manganese
Selenium
Selenium
21%
8.1%
20%
172%
52%
28%
55%
162%
132%
24%
3
100 g
300 g
0.5 cup - 141g
Magnesium
Magnesium
Calcium
Calcium
Potassium
Potassium
Iron
Iron
Copper
Copper
Zinc
Zinc
Phosphorus
Phosphorus
Sodium
Sodium
Manganese
Manganese
Selenium
Selenium
11%
42%
18%
13%
10%
14%
56%
11%
0.91%
33%
Vitamin Comparison
Vitamin comparison score is based on the number of vitamins by which one or the other food is richer. The "coverage" charts below show how much of the daily needs can be covered by 300 grams of the food.
8
100 g
300 g
1 oz - 28.35g 10 twists - 60g
Vitamin C
Vit. C
Vitamin D
Vit. D
Vitamin A
Vit. A
Vitamin E
Vit. E
Vitamin B1
Vit. B1
Vitamin B2
Vit. B2
Vitamin B3
Vit. B3
Vitamin B5
Vit. B5
Vitamin B6
Vit. B6
Vitamin B12
Vit. B12
Vitamin K
Vit. K
Folate
Folate
7%
0%
0%
9.4%
106%
77%
99%
19%
17%
0%
7%
125%
4
100 g
300 g
0.5 cup - 141g
Vitamin C
Vit. C
Vitamin D
Vit. D
Vitamin A
Vit. A
Vitamin E
Vit. E
Vitamin B1
Vit. B1
Vitamin B2
Vit. B2
Vitamin B3
Vit. B3
Vitamin B5
Vit. B5
Vitamin B6
Vit. B6
Vitamin B12
Vit. B12
Vitamin K
Vit. K
Folate
Folate
0.33%
18%
17%
1.2%
15%
51%
2.5%
42%
15%
65%
0.5%
6.8%
All nutrients comparison - raw data values
Nutrient
DV% diff.
Iron
4.58mg
0.34mg
53%
Sodium
1240mg
84mg
50%
Manganese
1.015mg
0.007mg
44%
Folate
166µg
9µg
39%
Vitamin B3
5.27mg
0.132mg
32%
Starch
72.58g
30%
Vitamin B1
0.424mg
0.061mg
30%
Vitamin B12
0µg
0.52µg
22%
Carbs
80.39g
17.6g
21%
Cholesterol
0mg
51mg
17%
Fiber
3.4g
0g
14%
Copper
0.156mg
0.03mg
14%
Calories
384kcal
122kcal
13%
Protein
10.04g
3.99g
12%
Calcium
27mg
139mg
11%
Vitamin B2
0.332mg
0.22mg
9%
Vitamin B5
0.322mg
0.699mg
8%
Saturated fat
0.391g
2.032g
7%
Polyunsaturated fat
1.291g
0.312g
7%
Vitamin D*
0 IU
47 IU
6%
Vitamin D
0µg
1.2µg
6%
Vitamin A
0µg
52µg
6%
Zinc
1.04mg
0.51mg
5%
Magnesium
29mg
16mg
3%
Vitamin E
0.47mg
0.06mg
3%
Selenium
4.4µg
6µg
3%
Choline
29.5mg
11.8mg
3%
Fats
2.93g
4g
2%
Vitamin C
2.1mg
0.1mg
2%
Vitamin K
2.8µg
0.2µg
2%
Vitamin B6
0.074mg
0.064mg
1%
Monounsaturated fat
0.727g
1.127g
1%
Protein per 100 calories
2.6g
3.3g
N/A
Calories per 10 g protein
382kcal
306kcal
N/A
Weight per 100 calories
26g
82g
N/A
Unsaturated / Saturated Fat ratio
5.2
0.71
N/A
Net carbs
76.99g
17.6g
N/A
Potassium
223mg
207mg
0%
Sugar
2.21g
4.82g
N/A
Phosphorus
128mg
130mg
0%
Trans fat
0.004g
N/A
Tryptophan
0.097mg
0.082mg
0%
Threonine
0.25mg
0.192mg
0%
Isoleucine
0.407mg
0.207mg
0%
Leucine
0.757mg
0.337mg
0%
Lysine
0.257mg
0.214mg
0%
Methionine
0.177mg
0.091mg
0%
Phenylalanine
0.52mg
0.173mg
0%
Valine
0.48mg
0.233mg
0%
Histidine
0.22mg
0.092mg
0%
Fructose
0.31g
0g
0%
Omega-3 - DHA
0g
0.003g
N/A
Omega-3 - ALA
0.063g
N/A
Omega-6 - Gamma-linoleic acid
0.001g
N/A
Omega-6 - Linoleic acid
1.223g
N/A
Macronutrient Comparison
Macronutrient breakdown side-by-side comparison
3
10%
3%
80%
3%
4%
Protein:
10.04 g
Fats:
2.93 g
Carbs:
80.39 g
Water:
3.13 g
Other:
3.51 g
2
4%
4%
18%
73%
Protein:
3.99 g
Fats:
4 g
Carbs:
17.6 g
Water:
73.45 g
Other:
0.96 g
Contains
more
Protein Protein
+151.6%
Contains
more
Carbs Carbs
+356.8%
Contains
more
Other Other
+265.6%
Contains
more
Fats Fats
+36.5%
Contains
more
Water Water
+2246.6%
Fat Type Comparison
Fat type breakdown side-by-side comparison
2
16%
30%
54%
Saturated fat:
Sat. Fat
0.391 g
Monounsaturated fat:
Mono. Fat
0.727 g
Polyunsaturated fat:
Poly. Fat
1.291 g
1
59%
32%
9%
Saturated fat:
Sat. Fat
2.032 g
Monounsaturated fat:
Mono. Fat
1.127 g
Polyunsaturated fat:
Poly. Fat
0.312 g
Contains
less
Sat. Fat Saturated fat
-80.8%
Contains
more
Poly. Fat Polyunsaturated fat
+313.8%
Contains
more
Mono. Fat Monounsaturated fat
+55%
Carbohydrate type comparison
Carbohydrate type breakdown side-by-side comparison
4
97%
Starch:
72.58 g
Sucrose:
0 g
Glucose:
0.69 g
Fructose:
0.31 g
Lactose:
0 g
Maltose:
1.11 g
Galactose:
0 g
1
100%
Starch:
0 g
Sucrose:
0 g
Glucose:
0 g
Fructose:
0 g
Lactose:
4.63 g
Maltose:
0 g
Galactose:
0 g
Contains
more
Starch Starch
+∞%
Contains
more
Glucose Glucose
+∞%
Contains
more
Fructose Fructose
+∞%
Contains
more
Maltose Maltose
+∞%
Contains
more
Lactose Lactose
+∞%
~equal in
Sucrose
~0g
~equal in
Galactose
~0g