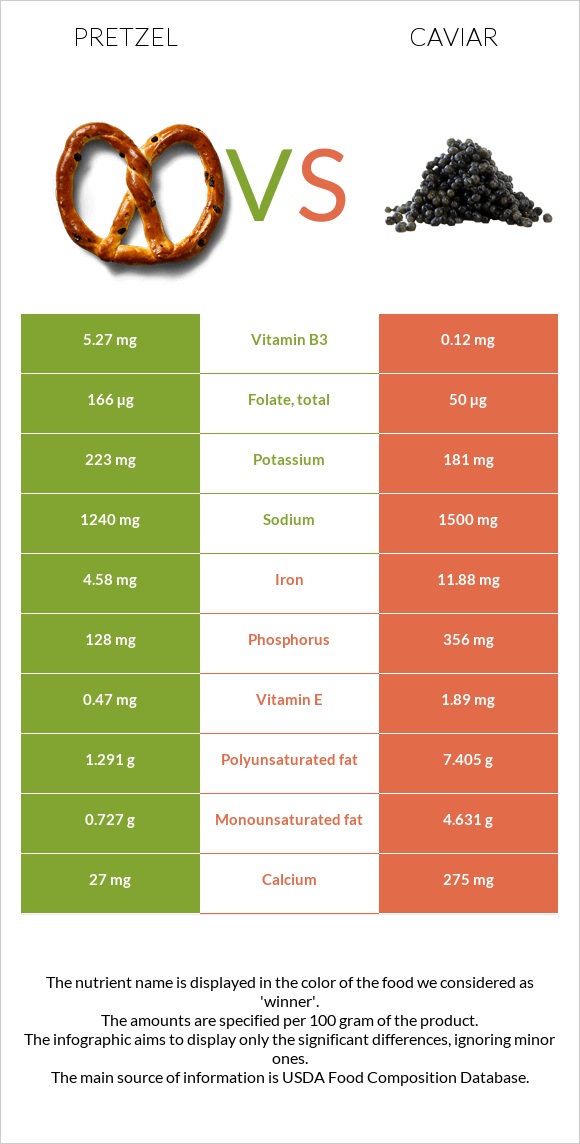
How are pretzel and caviar different? Pretzel is higher in manganese and vitamin B3; however, caviar is richer in vitamin B12, selenium, iron, choline, magnesium, vitamin B5, and phosphorus. Daily need coverage for vitamin B12 for caviar is 833% higher. Pretzel contains 44 times more vitamin B3 than caviar. While pretzel contains 5.27mg of vitamin B3, caviar contains only 0.12mg. Caviar has a lower glycemic index (0) than pretzel (83). Snacks, pretzels, hard, plain, salted and Fish, caviar, black, and red, granular are the varieties used in this article.
Infographic
Mineral Comparison
Mineral comparison score is based on the number of minerals by which one or the other food is richer. The "coverage" charts below show how much of the daily needs can be covered by 300 grams of the food.
4
100 g
300 g
1 oz - 28.35g 10 twists - 60g
Magnesium
Magnesium
Calcium
Calcium
Potassium
Potassium
Iron
Iron
Copper
Copper
Zinc
Zinc
Phosphorus
Phosphorus
Sodium
Sodium
Manganese
Manganese
Selenium
Selenium
21%
8.1%
20%
172%
52%
28%
55%
162%
132%
24%
5
100 g
300 g
1 tbsp - 16g 1 oz - 28.35g
Magnesium
Magnesium
Calcium
Calcium
Potassium
Potassium
Iron
Iron
Copper
Copper
Zinc
Zinc
Phosphorus
Phosphorus
Sodium
Sodium
Manganese
Manganese
Selenium
Selenium
214%
83%
16%
446%
37%
26%
153%
196%
6.5%
357%
Vitamin Comparison
Vitamin comparison score is based on the number of vitamins by which one or the other food is richer. The "coverage" charts below show how much of the daily needs can be covered by 300 grams of the food.
5
100 g
300 g
1 oz - 28.35g 10 twists - 60g
Vitamin C
Vit. C
Vitamin D
Vit. D
Vitamin A
Vit. A
Vitamin E
Vit. E
Vitamin B1
Vit. B1
Vitamin B2
Vit. B2
Vitamin B3
Vit. B3
Vitamin B5
Vit. B5
Vitamin B6
Vit. B6
Vitamin B12
Vit. B12
Vitamin K
Vit. K
Folate
Folate
7%
0%
0%
9.4%
106%
77%
99%
19%
17%
0%
7%
125%
7
100 g
300 g
1 tbsp - 16g 1 oz - 28.35g
Vitamin C
Vit. C
Vitamin D
Vit. D
Vitamin A
Vit. A
Vitamin E
Vit. E
Vitamin B1
Vit. B1
Vitamin B2
Vit. B2
Vitamin B3
Vit. B3
Vitamin B5
Vit. B5
Vitamin B6
Vit. B6
Vitamin B12
Vit. B12
Vitamin K
Vit. K
Folate
Folate
0%
44%
90%
38%
48%
143%
2.3%
210%
74%
2500%
1.5%
38%
All nutrients comparison - raw data values
Nutrient
DV% diff.
Vitamin B12
0µg
20µg
833%
Cholesterol
0mg
588mg
196%
Selenium
4.4µg
65.5µg
111%
Iron
4.58mg
11.88mg
91%
Choline
29.5mg
490.9mg
84%
Magnesium
29mg
300mg
65%
Vitamin B5
0.322mg
3.5mg
64%
Manganese
1.015mg
0.05mg
42%
Polyunsaturated fat
1.291g
7.405g
41%
Phosphorus
128mg
356mg
33%
Vitamin B3
5.27mg
0.12mg
32%
Starch
72.58g
30%
Vitamin A
0µg
271µg
30%
Protein
10.04g
24.6g
29%
Folate
166µg
50µg
29%
Carbs
80.39g
4g
25%
Calcium
27mg
275mg
25%
Fats
2.93g
17.9g
23%
Vitamin B2
0.332mg
0.62mg
22%
Vitamin B1
0.424mg
0.19mg
20%
Vitamin B6
0.074mg
0.32mg
19%
Saturated fat
0.391g
4.06g
17%
Vitamin D*
0 IU
117 IU
15%
Vitamin D
0µg
2.9µg
15%
Fiber
3.4g
0g
14%
Sodium
1240mg
1500mg
11%
Monounsaturated fat
0.727g
4.631g
10%
Vitamin E
0.47mg
1.89mg
9%
Calories
384kcal
264kcal
6%
Copper
0.156mg
0.11mg
5%
Vitamin C
2.1mg
0mg
2%
Vitamin K
2.8µg
0.6µg
2%
Potassium
223mg
181mg
1%
Zinc
1.04mg
0.95mg
1%
Protein per 100 calories
2.6g
9.3g
N/A
Calories per 10 g protein
382kcal
107kcal
N/A
Weight per 100 calories
26g
38g
N/A
Unsaturated / Saturated Fat ratio
5.2
3
N/A
Net carbs
76.99g
4g
N/A
Sugar
2.21g
0g
N/A
Trans fat
0.004g
N/A
Tryptophan
0.097mg
0.323mg
0%
Threonine
0.25mg
1.263mg
0%
Isoleucine
0.407mg
1.035mg
0%
Leucine
0.757mg
2.133mg
0%
Lysine
0.257mg
1.834mg
0%
Methionine
0.177mg
0.646mg
0%
Phenylalanine
0.52mg
1.071mg
0%
Valine
0.48mg
1.263mg
0%
Histidine
0.22mg
0.649mg
0%
Fructose
0.31g
0%
Omega-3 - EPA
0g
2.741g
N/A
Omega-3 - DHA
0g
3.8g
N/A
Omega-3 - ALA
0.063g
N/A
Omega-3 - DPA
0g
0.229g
N/A
Omega-6 - Gamma-linoleic acid
0.001g
N/A
Omega-6 - Linoleic acid
1.223g
N/A
Macronutrient Comparison
Macronutrient breakdown side-by-side comparison
1
10%
3%
80%
3%
4%
Protein:
10.04 g
Fats:
2.93 g
Carbs:
80.39 g
Water:
3.13 g
Other:
3.51 g
4
25%
18%
4%
48%
6%
Protein:
24.6 g
Fats:
17.9 g
Carbs:
4 g
Water:
47.5 g
Other:
6 g
Contains
more
Carbs Carbs
+1909.8%
Contains
more
Protein Protein
+145%
Contains
more
Fats Fats
+510.9%
Contains
more
Water Water
+1417.6%
Contains
more
Other Other
+70.9%
Fat Type Comparison
Fat type breakdown side-by-side comparison
1
16%
30%
54%
Saturated fat:
Sat. Fat
0.391 g
Monounsaturated fat:
Mono. Fat
0.727 g
Polyunsaturated fat:
Poly. Fat
1.291 g
2
25%
29%
46%
Saturated fat:
Sat. Fat
4.06 g
Monounsaturated fat:
Mono. Fat
4.631 g
Polyunsaturated fat:
Poly. Fat
7.405 g
Contains
less
Sat. Fat Saturated fat
-90.4%
Contains
more
Mono. Fat Monounsaturated fat
+537%
Contains
more
Poly. Fat Polyunsaturated fat
+473.6%