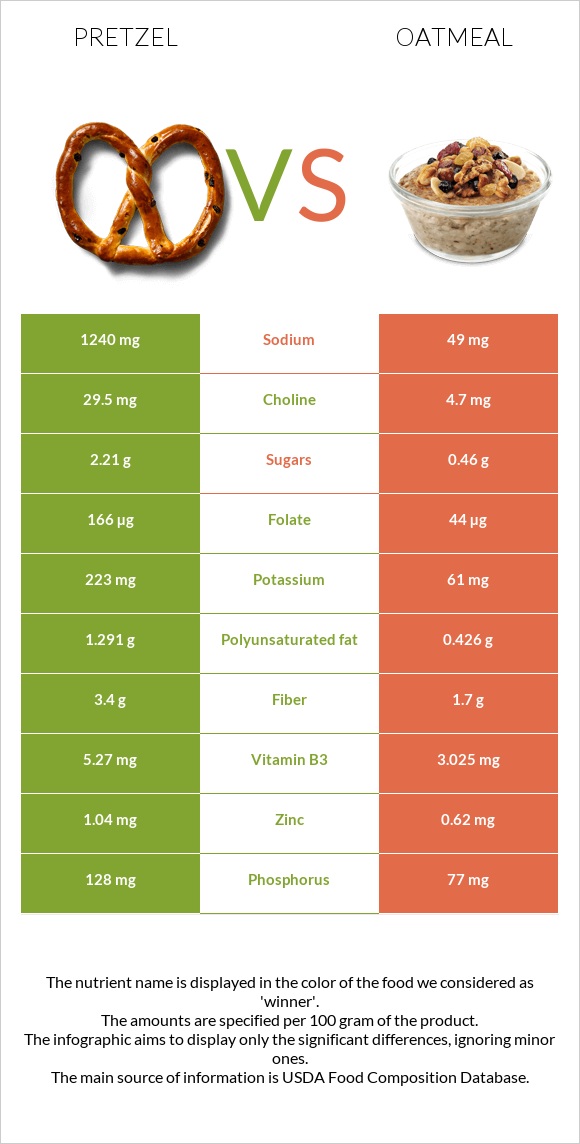
Significant differences between pretzel and oatmeal Pretzel has more folate, manganese, vitamin B3, vitamin B1, copper, and vitamin B2; however, oatmeal is richer in iron, vitamin B6, and vitamin A. Pretzel covers your daily sodium needs 52% more than oatmeal. Oatmeal has 4 times less folate than pretzel. Pretzel has 166µg of folate, while oatmeal has 44µg. Oatmeal contains less sodium. Specific food types used in this comparison are Snacks, pretzels, hard, plain, salted and Cereals, oats, instant, fortified, plain, prepared with water (boiling water added or microwaved) .
Infographic
Mineral Comparison
Mineral comparison score is based on the number of minerals by which one or the other food is richer. The "coverage" charts below show how much of the daily needs can be covered by 300 grams of the food.
6
100 g
300 g
1 oz - 28.35g 10 twists - 60g
Magnesium
Magnesium
Calcium
Calcium
Potassium
Potassium
Iron
Iron
Copper
Copper
Zinc
Zinc
Phosphorus
Phosphorus
Sodium
Sodium
Manganese
Manganese
Selenium
Selenium
21%
8.1%
20%
172%
52%
28%
55%
162%
132%
24%
4
100 g
300 g
1 oz, dry, yields - 177g 1 packet, dry, yields - 177g 1 cup, cooked - 234g 1 cup, dry, yields - 501g
Magnesium
Magnesium
Calcium
Calcium
Potassium
Potassium
Iron
Iron
Copper
Copper
Zinc
Zinc
Phosphorus
Phosphorus
Sodium
Sodium
Manganese
Manganese
Selenium
Selenium
19%
24%
5.4%
224%
22%
17%
33%
6.4%
73%
27%
Vitamin Comparison
Vitamin comparison score is based on the number of vitamins by which one or the other food is richer. The "coverage" charts below show how much of the daily needs can be covered by 300 grams of the food.
7
100 g
300 g
1 oz - 28.35g 10 twists - 60g
Vitamin C
Vit. C
Vitamin D
Vit. D
Vitamin A
Vit. A
Vitamin E
Vit. E
Vitamin B1
Vit. B1
Vitamin B2
Vit. B2
Vitamin B3
Vit. B3
Vitamin B5
Vit. B5
Vitamin B6
Vit. B6
Vitamin B12
Vit. B12
Vitamin K
Vit. K
Folate
Folate
7%
0%
0%
9.4%
106%
77%
99%
19%
17%
0%
7%
125%
2
100 g
300 g
1 oz, dry, yields - 177g 1 packet, dry, yields - 177g 1 cup, cooked - 234g 1 cup, dry, yields - 501g
Vitamin C
Vit. C
Vitamin D
Vit. D
Vitamin A
Vit. A
Vitamin E
Vit. E
Vitamin B1
Vit. B1
Vitamin B2
Vit. B2
Vitamin B3
Vit. B3
Vitamin B5
Vit. B5
Vitamin B6
Vit. B6
Vitamin B12
Vit. B12
Vitamin K
Vit. K
Folate
Folate
0%
0%
43%
1.4%
65%
50%
57%
19%
67%
0%
1%
33%
All nutrients comparison - raw data values
Nutrient
DV% diff.
Sodium
1240mg
49mg
52%
Folate
166µg
44µg
31%
Starch
72.58g
10.37g
26%
Carbs
80.39g
11.67g
23%
Manganese
1.015mg
0.558mg
20%
Iron
4.58mg
5.96mg
17%
Vitamin B6
0.074mg
0.29mg
17%
Calories
384kcal
68kcal
16%
Protein
10.04g
2.37g
15%
Vitamin A
0µg
130µg
14%
Vitamin B1
0.424mg
0.26mg
14%
Vitamin B3
5.27mg
3.025mg
14%
Copper
0.156mg
0.066mg
10%
Vitamin B2
0.332mg
0.215mg
9%
Fiber
3.4g
1.7g
7%
Phosphorus
128mg
77mg
7%
Polyunsaturated fat
1.291g
0.426g
6%
Calcium
27mg
80mg
5%
Potassium
223mg
61mg
5%
Choline
29.5mg
4.7mg
5%
Zinc
1.04mg
0.62mg
4%
Vitamin E
0.47mg
0.07mg
3%
Fats
2.93g
1.36g
2%
Vitamin C
2.1mg
0mg
2%
Vitamin K
2.8µg
0.4µg
2%
Magnesium
29mg
26mg
1%
Selenium
4.4µg
5µg
1%
Saturated fat
0.391g
0.226g
1%
Monounsaturated fat
0.727g
0.391g
1%
Protein per 100 calories
2.6g
3.5g
N/A
Calories per 10 g protein
382kcal
287kcal
N/A
Weight per 100 calories
26g
147g
N/A
Unsaturated / Saturated Fat ratio
5.2
3.6
N/A
Net carbs
76.99g
9.97g
N/A
Sugar
2.21g
0.46g
N/A
Vitamin B5
0.322mg
0.317mg
0%
Trans fat
0.004g
0.003g
N/A
Tryptophan
0.097mg
0.04mg
0%
Threonine
0.25mg
0.083mg
0%
Isoleucine
0.407mg
0.105mg
0%
Leucine
0.757mg
0.2mg
0%
Lysine
0.257mg
0.135mg
0%
Methionine
0.177mg
0.04mg
0%
Phenylalanine
0.52mg
0.13mg
0%
Valine
0.48mg
0.151mg
0%
Histidine
0.22mg
0.057mg
0%
Fructose
0.31g
0g
0%
Omega-3 - ALA
0.063g
N/A
Omega-6 - Gamma-linoleic acid
0.001g
N/A
Omega-6 - Linoleic acid
1.223g
N/A
Macronutrient Comparison
Macronutrient breakdown side-by-side comparison
4
10%
3%
80%
3%
4%
Protein:
10.04 g
Fats:
2.93 g
Carbs:
80.39 g
Water:
3.13 g
Other:
3.51 g
1
2%
12%
84%
Protein:
2.37 g
Fats:
1.36 g
Carbs:
11.67 g
Water:
84.03 g
Other:
0.57 g
Contains
more
Protein Protein
+323.6%
Contains
more
Fats Fats
+115.4%
Contains
more
Carbs Carbs
+588.9%
Contains
more
Other Other
+515.8%
Contains
more
Water Water
+2584.7%
Fat Type Comparison
Fat type breakdown side-by-side comparison
2
16%
30%
54%
Saturated fat:
Sat. Fat
0.391 g
Monounsaturated fat:
Mono. Fat
0.727 g
Polyunsaturated fat:
Poly. Fat
1.291 g
1
22%
37%
41%
Saturated fat:
Sat. Fat
0.226 g
Monounsaturated fat:
Mono. Fat
0.391 g
Polyunsaturated fat:
Poly. Fat
0.426 g
Contains
more
Mono. Fat Monounsaturated fat
+85.9%
Contains
more
Poly. Fat Polyunsaturated fat
+203.1%
Contains
less
Sat. Fat Saturated fat
-42.2%
Carbohydrate type comparison
Carbohydrate type breakdown side-by-side comparison
4
97%
Starch:
72.58 g
Sucrose:
0 g
Glucose:
0.69 g
Fructose:
0.31 g
Lactose:
0 g
Maltose:
1.11 g
Galactose:
0 g
2
96%
3%
Starch:
10.37 g
Sucrose:
0.29 g
Glucose:
0 g
Fructose:
0 g
Lactose:
0 g
Maltose:
0 g
Galactose:
0.16 g
Contains
more
Starch Starch
+599.9%
Contains
more
Glucose Glucose
+∞%
Contains
more
Fructose Fructose
+∞%
Contains
more
Maltose Maltose
+∞%
Contains
more
Sucrose Sucrose
+∞%
Contains
more
Galactose Galactose
+∞%