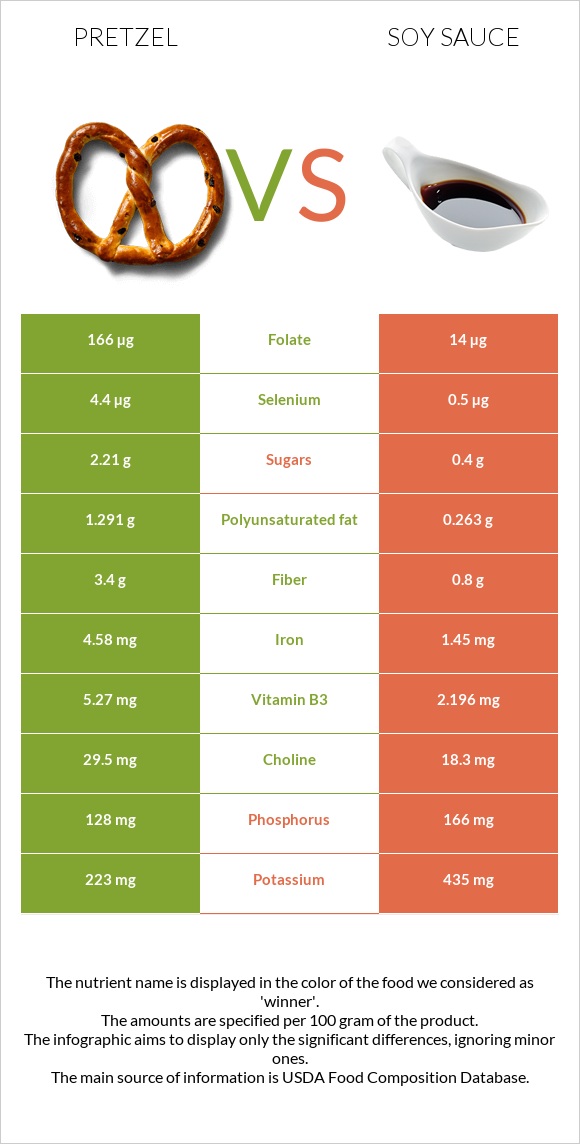
Significant differences between pretzel and soy sauce Pretzel has more iron, folate, vitamin B1, vitamin B3, vitamin B2, copper, fiber, and selenium; however, soy sauce is richer in magnesium. Soy sauce covers your daily sodium needs 185% more than pretzel. Soy sauce has 13 times less vitamin B1 than pretzel. Pretzel has 0.424mg of vitamin B1, while soy sauce has 0.033mg. Pretzel contains less sodium. Pretzel has a higher glycemic index. The glycemic index of pretzel is 83, while the glycemic index of soy sauce is 15. Specific food types used in this comparison are Snacks, pretzels, hard, plain, salted and Soy sauce made from soy and wheat (shoyu) .
Infographic
Mineral Comparison
Mineral comparison score is based on the number of minerals by which one or the other food is richer. The "coverage" charts below show how much of the daily needs can be covered by 300 grams of the food.
5
100 g
300 g
1 oz - 28.35g 10 twists - 60g
Magnesium
Magnesium
Calcium
Calcium
Potassium
Potassium
Iron
Iron
Copper
Copper
Zinc
Zinc
Phosphorus
Phosphorus
Sodium
Sodium
Manganese
Manganese
Selenium
Selenium
21%
8.1%
20%
172%
52%
28%
55%
162%
132%
24%
4
100 g
300 g
1 tsp - 5.3g 1 individual packet - 8.9g 1 tbsp - 16g 1 cup - 255g
Magnesium
Magnesium
Calcium
Calcium
Potassium
Potassium
Iron
Iron
Copper
Copper
Zinc
Zinc
Phosphorus
Phosphorus
Sodium
Sodium
Manganese
Manganese
Selenium
Selenium
53%
9.9%
38%
54%
14%
24%
71%
716%
133%
2.7%
Vitamin Comparison
Vitamin comparison score is based on the number of vitamins by which one or the other food is richer. The "coverage" charts below show how much of the daily needs can be covered by 300 grams of the food.
7
100 g
300 g
1 oz - 28.35g 10 twists - 60g
Vitamin C
Vit. C
Vitamin D
Vit. D
Vitamin A
Vit. A
Vitamin E
Vit. E
Vitamin B1
Vit. B1
Vitamin B2
Vit. B2
Vitamin B3
Vit. B3
Vitamin B5
Vit. B5
Vitamin B6
Vit. B6
Vitamin B12
Vit. B12
Vitamin K
Vit. K
Folate
Folate
7%
0%
0%
9.4%
106%
77%
99%
19%
17%
0%
7%
125%
1
100 g
300 g
1 tsp - 5.3g 1 individual packet - 8.9g 1 tbsp - 16g 1 cup - 255g
Vitamin C
Vit. C
Vitamin D
Vit. D
Vitamin A
Vit. A
Vitamin E
Vit. E
Vitamin B1
Vit. B1
Vitamin B2
Vit. B2
Vitamin B3
Vit. B3
Vitamin B5
Vit. B5
Vitamin B6
Vit. B6
Vitamin B12
Vit. B12
Vitamin K
Vit. K
Folate
Folate
0%
0%
0%
0%
8.3%
38%
41%
18%
34%
0%
0%
11%
All nutrients comparison - raw data values
Nutrient
DV% diff.
Sodium
1240mg
5493mg
185%
Iron
4.58mg
1.45mg
39%
Folate
166µg
14µg
38%
Vitamin B1
0.424mg
0.033mg
33%
Starch
72.58g
30%
Carbs
80.39g
4.93g
25%
Vitamin B3
5.27mg
2.196mg
19%
Calories
384kcal
53kcal
17%
Copper
0.156mg
0.043mg
13%
Vitamin B2
0.332mg
0.165mg
13%
Magnesium
29mg
74mg
11%
Fiber
3.4g
0.8g
10%
Selenium
4.4µg
0.5µg
7%
Polyunsaturated fat
1.291g
0.263g
7%
Potassium
223mg
435mg
6%
Vitamin B6
0.074mg
0.148mg
6%
Phosphorus
128mg
166mg
5%
Protein
10.04g
8.14g
4%
Fats
2.93g
0.57g
4%
Vitamin E
0.47mg
0mg
3%
Vitamin C
2.1mg
0mg
2%
Zinc
1.04mg
0.87mg
2%
Vitamin K
2.8µg
0µg
2%
Choline
29.5mg
18.3mg
2%
Monounsaturated fat
0.727g
0.088g
2%
Calcium
27mg
33mg
1%
Vitamin B5
0.322mg
0.297mg
1%
Saturated fat
0.391g
0.073g
1%
Protein per 100 calories
2.6g
15g
N/A
Calories per 10 g protein
382kcal
65kcal
N/A
Weight per 100 calories
26g
189g
N/A
Unsaturated / Saturated Fat ratio
5.2
4.8
N/A
Net carbs
76.99g
4.13g
N/A
Sugar
2.21g
0.4g
N/A
Manganese
1.015mg
1.018mg
0%
Trans fat
0.004g
0g
N/A
Tryptophan
0.097mg
0.096mg
0%
Threonine
0.25mg
0.271mg
0%
Isoleucine
0.407mg
0.318mg
0%
Leucine
0.757mg
0.537mg
0%
Lysine
0.257mg
0.381mg
0%
Methionine
0.177mg
0.097mg
0%
Phenylalanine
0.52mg
0.353mg
0%
Valine
0.48mg
0.332mg
0%
Histidine
0.22mg
0.174mg
0%
Fructose
0.31g
0g
0%
Omega-3 - ALA
0.063g
N/A
Omega-6 - Gamma-linoleic acid
0.001g
N/A
Omega-6 - Linoleic acid
1.223g
N/A
Macronutrient Comparison
Macronutrient breakdown side-by-side comparison
3
10%
3%
80%
3%
4%
Protein:
10.04 g
Fats:
2.93 g
Carbs:
80.39 g
Water:
3.13 g
Other:
3.51 g
2
8%
5%
71%
15%
Protein:
8.14 g
Fats:
0.57 g
Carbs:
4.93 g
Water:
71.15 g
Other:
15.21 g
Contains
more
Protein Protein
+23.3%
Contains
more
Fats Fats
+414%
Contains
more
Carbs Carbs
+1530.6%
Contains
more
Water Water
+2173.2%
Contains
more
Other Other
+333.3%
Fat Type Comparison
Fat type breakdown side-by-side comparison
2
16%
30%
54%
Saturated fat:
Sat. Fat
0.391 g
Monounsaturated fat:
Mono. Fat
0.727 g
Polyunsaturated fat:
Poly. Fat
1.291 g
1
17%
21%
62%
Saturated fat:
Sat. Fat
0.073 g
Monounsaturated fat:
Mono. Fat
0.088 g
Polyunsaturated fat:
Poly. Fat
0.263 g
Contains
more
Mono. Fat Monounsaturated fat
+726.1%
Contains
more
Poly. Fat Polyunsaturated fat
+390.9%
Contains
less
Sat. Fat Saturated fat
-81.3%
Carbohydrate type comparison
Carbohydrate type breakdown side-by-side comparison
4
97%
Starch:
72.58 g
Sucrose:
0 g
Glucose:
0.69 g
Fructose:
0.31 g
Lactose:
0 g
Maltose:
1.11 g
Galactose:
0 g
1
25%
75%
Starch:
0 g
Sucrose:
0.1 g
Glucose:
0.3 g
Fructose:
0 g
Lactose:
0 g
Maltose:
0 g
Galactose:
0 g
Contains
more
Starch Starch
+∞%
Contains
more
Glucose Glucose
+130%
Contains
more
Fructose Fructose
+∞%
Contains
more
Maltose Maltose
+∞%
Contains
more
Sucrose Sucrose
+∞%
~equal in
Lactose
~0g
~equal in
Galactose
~0g