Snickers vs. Broth — In-Depth Nutrition Comparison
Compare
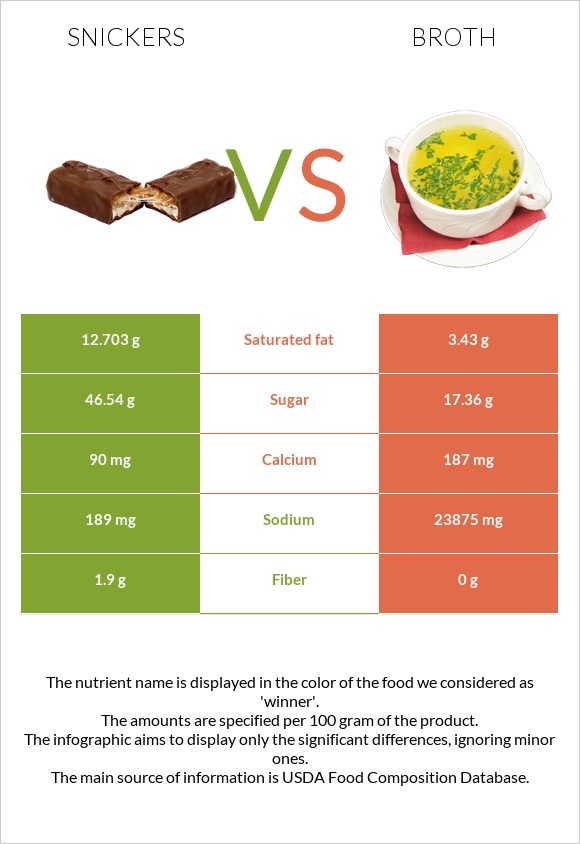
How are snickers and broth different?
- Snickers is higher in fiber; however, broth is richer in calcium.
- Daily need coverage for sodium for broth is 1030% higher.
- Broth has less saturated fat.
Candies, MARS SNACKFOOD US, SNICKERS CRUNCHER and Soup, chicken broth or bouillon, dry are the varieties used in this article.
Infographic
Infographic link
Mineral Comparison
Mineral comparison score is based on the number of minerals by which one or the other food is richer. The "coverage" charts below show how much of the daily needs can be covered by 300 grams of the food.
| Contains less SodiumSodium | -99.2% |
| Contains more CalciumCalcium | +107.8% |
| Contains more IronIron | +51.5% |
Vitamin Comparison
Vitamin comparison score is based on the number of vitamins by which one or the other food is richer. The "coverage" charts below show how much of the daily needs can be covered by 300 grams of the food.
| Contains more Vitamin CVitamin C | +120% |
All nutrients comparison - raw data values
| Nutrient |  |
 |
DV% diff. |
| Sodium | 189mg | 23875mg | 1030% |
| Selenium | 28µg | 51% | |
| Saturated fat | 12.703g | 3.43g | 42% |
| Vitamin B2 | 0.43mg | 33% | |
| Polyunsaturated fat | 4.48g | 30% | |
| Phosphorus | 166mg | 24% | |
| Choline | 114.6mg | 21% | |
| Protein | 6.86g | 16.66g | 20% |
| Fats | 24.38g | 13.88g | 16% |
| Carbs | 62.85g | 18.01g | 15% |
| Vitamin B3 | 2.46mg | 15% | |
| Magnesium | 56mg | 13% | |
| Vitamin B12 | 0.3µg | 13% | |
| Monounsaturated fat | 5.36g | 13% | |
| Vitamin B5 | 0.6mg | 12% | |
| Calories | 488kcal | 267kcal | 11% |
| Calcium | 90mg | 187mg | 10% |
| Potassium | 309mg | 9% | |
| Fiber | 1.9g | 0g | 8% |
| Vitamin B1 | 0.1mg | 8% | |
| Vitamin B6 | 0.1mg | 8% | |
| Folate | 32µg | 8% | |
| Manganese | 0.15mg | 7% | |
| Iron | 0.68mg | 1.03mg | 4% |
| Vitamin E | 0.46mg | 3% | |
| Vitamin C | 0.5mg | 1.1mg | 1% |
| Cholesterol | 9mg | 13mg | 1% |
| Zinc | 0.09mg | 1% | |
| Net carbs | 60.95g | 18.01g | N/A |
| Sugar | 46.54g | 17.36g | N/A |
| Trans fat | 0.394g | N/A |
Macronutrient Comparison
Macronutrient breakdown side-by-side comparison
| Contains more FatsFats | +75.6% |
| Contains more CarbsCarbs | +249% |
| Contains more WaterWater | +96.9% |
| Contains more ProteinProtein | +142.9% |
| Contains more OtherOther | +3315.3% |
Fat Type Comparison
Fat type breakdown side-by-side comparison
| Contains less Sat. FatSaturated fat | -73% |


