Snickers vs. Pepperoni — In-Depth Nutrition Comparison
Compare
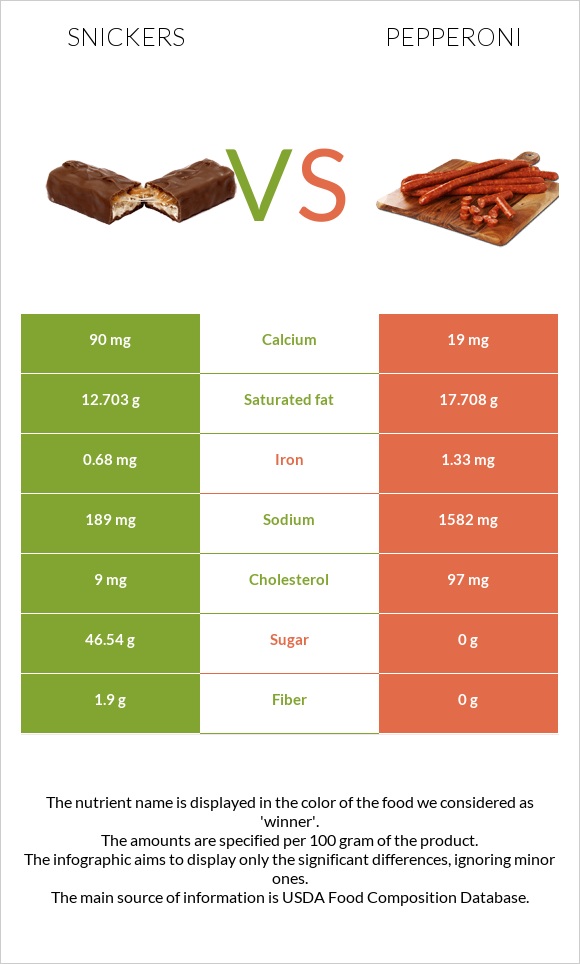
What are the main differences between snickers and pepperoni?
- Snickers is richer in fiber and calcium, while pepperoni is higher in iron.
- Pepperoni's daily need coverage for sodium is 61% higher.
- Pepperoni is lower in sugar.
- Snickers has a higher glycemic index (51) than pepperoni (28).
We used Candies, MARS SNACKFOOD US, SNICKERS CRUNCHER and Pepperoni, beef, and pork, sliced types in this comparison.
Infographic
Infographic link
Mineral Comparison
Mineral comparison score is based on the number of minerals by which one or the other food is richer. The "coverage" charts below show how much of the daily needs can be covered by 300 grams of the food.
| Contains more CalciumCalcium | +373.7% |
| Contains less SodiumSodium | -88.1% |
| Contains more IronIron | +95.6% |
Vitamin Comparison
Vitamin comparison score is based on the number of vitamins by which one or the other food is richer. The "coverage" charts below show how much of the daily needs can be covered by 300 grams of the food.
| Contains more Vitamin CVitamin C | +∞% |
All nutrients comparison - raw data values
| Nutrient |  |
 |
DV% diff. |
| Sodium | 189mg | 1582mg | 61% |
| Vitamin B12 | 1.3µg | 54% | |
| Selenium | 29µg | 53% | |
| Monounsaturated fat | 20.77g | 52% | |
| Manganese | 1.074mg | 47% | |
| Fats | 24.38g | 46.28g | 34% |
| Vitamin B3 | 4.987mg | 31% | |
| Polyunsaturated fat | 4.458g | 30% | |
| Cholesterol | 9mg | 97mg | 29% |
| Vitamin B6 | 0.362mg | 28% | |
| Protein | 6.86g | 19.25g | 25% |
| Phosphorus | 158mg | 23% | |
| Vitamin B1 | 0.271mg | 23% | |
| Saturated fat | 12.703g | 17.708g | 23% |
| Zinc | 2.44mg | 22% | |
| Carbs | 62.85g | 1.18g | 21% |
| Vitamin B2 | 0.257mg | 20% | |
| Vitamin B5 | 0.93mg | 19% | |
| Copper | 0.091mg | 10% | |
| Choline | 51.2mg | 9% | |
| Potassium | 274mg | 8% | |
| Iron | 0.68mg | 1.33mg | 8% |
| Fiber | 1.9g | 0g | 8% |
| Vitamin D | 52 IU | 7% | |
| Calcium | 90mg | 19mg | 7% |
| Vitamin E | 1.03mg | 7% | |
| Vitamin D | 1.3µg | 7% | |
| Vitamin K | 5.8µg | 5% | |
| Magnesium | 18mg | 4% | |
| Calories | 488kcal | 504kcal | 1% |
| Vitamin C | 0.5mg | 0mg | 1% |
| Folate | 5µg | 1% | |
| Net carbs | 60.95g | 1.18g | N/A |
| Sugar | 46.54g | 0g | N/A |
| Trans fat | 0.394g | 1.527g | N/A |
| Tryptophan | 0.23mg | 0% | |
| Threonine | 0.869mg | 0% | |
| Isoleucine | 0.901mg | 0% | |
| Leucine | 1.575mg | 0% | |
| Lysine | 1.652mg | 0% | |
| Methionine | 0.511mg | 0% | |
| Phenylalanine | 0.778mg | 0% | |
| Valine | 0.987mg | 0% | |
| Histidine | 0.688mg | 0% | |
| Omega-3 - EPA | 0.004g | N/A | |
| Omega-3 - DHA | 0.004g | N/A | |
| Omega-3 - ALA | 0.164g | N/A | |
| Omega-3 - DPA | 0.02g | N/A | |
| Omega-3 - Eicosatrienoic acid | 0.018g | N/A | |
| Omega-6 - Gamma-linoleic acid | 0.002g | N/A | |
| Omega-6 - Dihomo-gamma-linoleic acid | 0.04g | N/A | |
| Omega-6 - Eicosadienoic acid | 0.136g | N/A | |
| Omega-6 - Linoleic acid | 3.605g | N/A |
Macronutrient Comparison
Macronutrient breakdown side-by-side comparison
| Contains more CarbsCarbs | +5226.3% |
| Contains more ProteinProtein | +180.6% |
| Contains more FatsFats | +89.8% |
| Contains more WaterWater | +538.7% |
| Contains more OtherOther | +229.2% |
Fat Type Comparison
Fat type breakdown side-by-side comparison
| Contains less Sat. FatSaturated fat | -28.3% |


