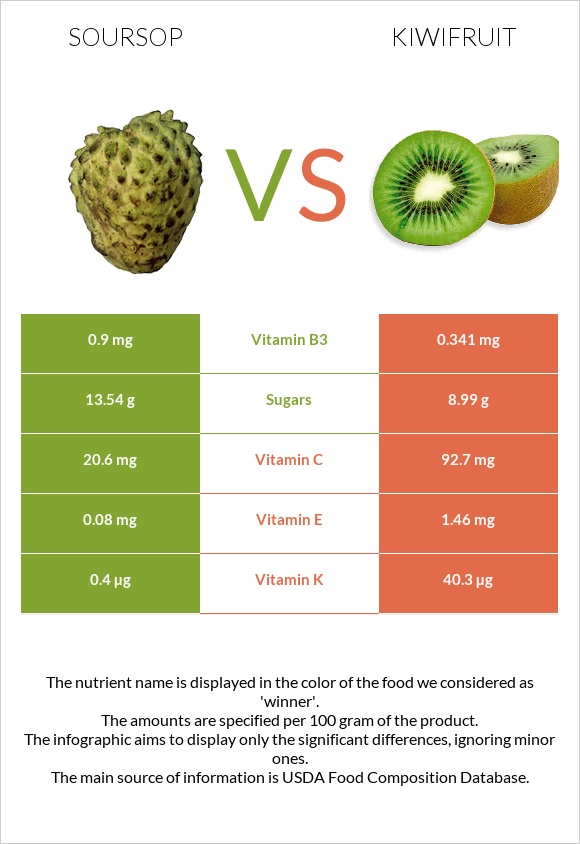
Summary of differences between soursop and kiwi Soursop has less vitamin C, vitamin K, and vitamin E than kiwi. Kiwi covers your daily need for vitamin C, 80% more than soursop. Soursop has 3 times more vitamin B3 than kiwi. While soursop has 0.9mg of vitamin B3, kiwi has only 0.341mg. Kiwi has less sugar. The glycemic index of kiwi is higher. These are the specific foods used in this comparison Soursop, raw and Kiwifruit, green, raw .
Infographic
Mineral Comparison
Mineral comparison score is based on the number of minerals by which one or the other food is richer. The "coverage" charts below show how much of the daily needs can be covered by 300 grams of the food.
3
100 g
300 g
1 cup, pulp - 225g 1 fruit (7" x 5-1/4" dia) - 625g
Magnesium
Magnesium
Calcium
Calcium
Potassium
Potassium
Iron
Iron
Copper
Copper
Zinc
Zinc
Phosphorus
Phosphorus
Sodium
Sodium
Manganese
Manganese
Selenium
Selenium
15%
4.2%
25%
23%
29%
2.7%
12%
1.8%
0%
3.3%
7
100 g
300 g
1 fruit (2" dia) - 69g 1 NLEA serving - 148g 1 cup, sliced - 180g
Magnesium
Magnesium
Calcium
Calcium
Potassium
Potassium
Iron
Iron
Copper
Copper
Zinc
Zinc
Phosphorus
Phosphorus
Sodium
Sodium
Manganese
Manganese
Selenium
Selenium
12%
10%
28%
12%
43%
3.8%
15%
0.39%
13%
1.1%
Vitamin Comparison
Vitamin comparison score is based on the number of vitamins by which one or the other food is richer. The "coverage" charts below show how much of the daily needs can be covered by 300 grams of the food.
4
100 g
300 g
1 cup, pulp - 225g 1 fruit (7" x 5-1/4" dia) - 625g
Vitamin C
Vit. C
Vitamin D
Vit. D
Vitamin A
Vit. A
Vitamin E
Vit. E
Vitamin B1
Vit. B1
Vitamin B2
Vit. B2
Vitamin B3
Vit. B3
Vitamin B5
Vit. B5
Vitamin B6
Vit. B6
Vitamin B12
Vit. B12
Vitamin K
Vit. K
Folate
Folate
69%
0%
0%
1.6%
18%
12%
17%
15%
14%
0%
1%
11%
5
100 g
300 g
1 fruit (2" dia) - 69g 1 NLEA serving - 148g 1 cup, sliced - 180g
Vitamin C
Vit. C
Vitamin D
Vit. D
Vitamin A
Vit. A
Vitamin E
Vit. E
Vitamin B1
Vit. B1
Vitamin B2
Vit. B2
Vitamin B3
Vit. B3
Vitamin B5
Vit. B5
Vitamin B6
Vit. B6
Vitamin B12
Vit. B12
Vitamin K
Vit. K
Folate
Folate
309%
0%
1.3%
29%
6.8%
5.8%
6.4%
11%
15%
0%
101%
19%
All nutrients comparison - raw data values
Nutrient
DV% diff.
Vitamin C
20.6mg
92.7mg
80%
Vitamin K
0.4µg
40.3µg
33%
Vitamin E
0.08mg
1.46mg
9%
Copper
0.086mg
0.13mg
5%
Fructose
4.35g
5%
Iron
0.6mg
0.31mg
4%
Manganese
0.098mg
4%
Vitamin B1
0.07mg
0.027mg
4%
Vitamin B3
0.9mg
0.341mg
3%
Folate
14µg
25µg
3%
Calcium
14mg
34mg
2%
Vitamin B2
0.05mg
0.025mg
2%
Carbs
16.84g
14.66g
1%
Magnesium
21mg
17mg
1%
Potassium
278mg
312mg
1%
Fiber
3.3g
3g
1%
Phosphorus
27mg
34mg
1%
Selenium
0.6µg
0.2µg
1%
Vitamin B5
0.253mg
0.183mg
1%
Polyunsaturated fat
0.069g
0.287g
1%
Calories
66kcal
61kcal
0%
Protein
1g
1.14g
0%
Protein per 100 calories
1.5g
1.9g
N/A
Calories per 10 g protein
660kcal
535kcal
N/A
Weight per 100 calories
152g
164g
N/A
Fats
0.3g
0.52g
0%
Net carbs
13.54g
11.66g
N/A
Sugar
13.54g
8.99g
N/A
Zinc
0.1mg
0.14mg
0%
Sodium
14mg
3mg
0%
Vitamin A
0µg
4µg
0%
Vitamin B6
0.059mg
0.063mg
0%
Choline
7.6mg
7.8mg
0%
Saturated fat
0.051g
0.029g
0%
Monounsaturated fat
0.09g
0.047g
0%
Tryptophan
0.011mg
0.015mg
0%
Threonine
0.047mg
0%
Isoleucine
0.051mg
0%
Leucine
0.066mg
0%
Lysine
0.06mg
0.061mg
0%
Methionine
0.007mg
0.024mg
0%
Phenylalanine
0.044mg
0%
Valine
0.057mg
0%
Histidine
0.027mg
0%
Macronutrient Comparison
Macronutrient breakdown side-by-side comparison
2
17%
81%
Protein:
1 g
Fats:
0.3 g
Carbs:
16.84 g
Water:
81.16 g
Other:
0.7 g
3
15%
83%
Protein:
1.14 g
Fats:
0.52 g
Carbs:
14.66 g
Water:
83.07 g
Other:
0.61 g
Contains
more
Carbs Carbs
+14.9%
Contains
more
Other Other
+14.8%
Contains
more
Protein Protein
+14%
Contains
more
Fats Fats
+73.3%
Fat Type Comparison
Fat type breakdown side-by-side comparison
1
24%
43%
33%
Saturated fat:
Sat. Fat
0.051 g
Monounsaturated fat:
Mono. Fat
0.09 g
Polyunsaturated fat:
Poly. Fat
0.069 g
2
8%
13%
79%
Saturated fat:
Sat. Fat
0.029 g
Monounsaturated fat:
Mono. Fat
0.047 g
Polyunsaturated fat:
Poly. Fat
0.287 g
Contains
more
Mono. Fat Monounsaturated fat
+91.5%
Contains
less
Sat. Fat Saturated fat
-43.1%
Contains
more
Poly. Fat Polyunsaturated fat
+315.9%