Soursop vs. Nectarine — In-Depth Nutrition Comparison
Compare
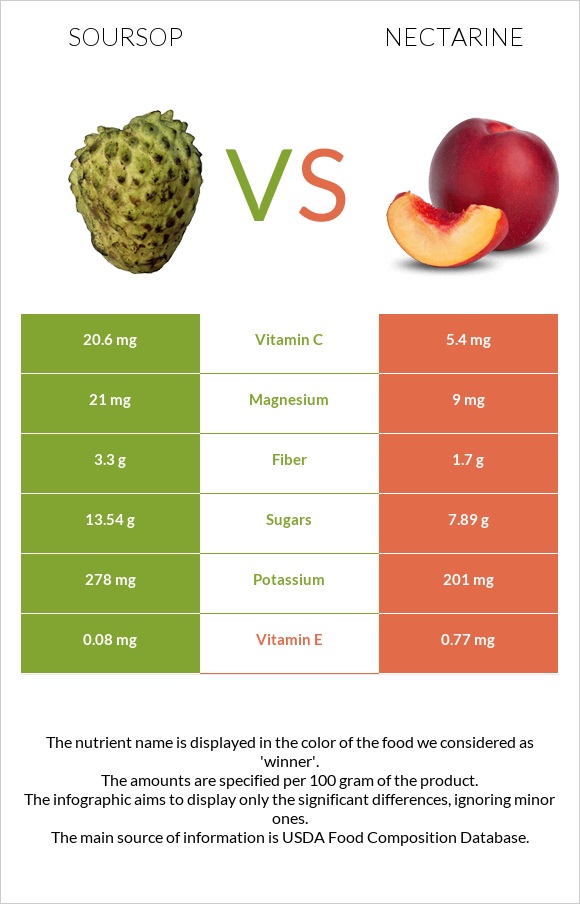
What are the main differences between soursop and nectarine?
- Soursop is richer in vitamin C and fiber, yet nectarine is richer in vitamin A.
- Soursop's daily need coverage for vitamin C is 17% higher.
- Soursop has 2 times more magnesium than nectarine. Soursop has 21mg of magnesium, while nectarine has 9mg.
- Nectarine contains less sugar.
- Soursop has a lower glycemic index than nectarine.
We used Soursop, raw and Nectarines, raw types in this comparison.
Infographic
Infographic link
Mineral Comparison
Mineral comparison score is based on the number of minerals by which one or the other food is richer. The "coverage" charts below show how much of the daily needs can be covered by 300 grams of the food.
| Contains more MagnesiumMagnesium | +133.3% |
| Contains more CalciumCalcium | +133.3% |
| Contains more PotassiumPotassium | +38.3% |
| Contains more IronIron | +114.3% |
| Contains more SeleniumSelenium | +∞% |
| Contains more ZincZinc | +70% |
| Contains less SodiumSodium | -100% |
Vitamin Comparison
Vitamin comparison score is based on the number of vitamins by which one or the other food is richer. The "coverage" charts below show how much of the daily needs can be covered by 300 grams of the food.
| Contains more Vitamin CVitamin C | +281.5% |
| Contains more Vitamin B1Vitamin B1 | +105.9% |
| Contains more Vitamin B2Vitamin B2 | +85.2% |
| Contains more Vitamin B5Vitamin B5 | +36.8% |
| Contains more Vitamin B6Vitamin B6 | +136% |
| Contains more FolateFolate | +180% |
| Contains more Vitamin AVitamin A | +∞% |
| Contains more Vitamin EVitamin E | +862.5% |
| Contains more Vitamin B3Vitamin B3 | +25% |
| Contains more Vitamin KVitamin K | +450% |
All nutrients comparison - raw data values
| Nutrient |  |
 |
DV% diff. |
| Vitamin C | 20.6mg | 5.4mg | 17% |
| Fiber | 3.3g | 1.7g | 6% |
| Vitamin E | 0.08mg | 0.77mg | 5% |
| Iron | 0.6mg | 0.28mg | 4% |
| Magnesium | 21mg | 9mg | 3% |
| Vitamin B1 | 0.07mg | 0.034mg | 3% |
| Vitamin B6 | 0.059mg | 0.025mg | 3% |
| Carbs | 16.84g | 10.55g | 2% |
| Potassium | 278mg | 201mg | 2% |
| Vitamin A | 0µg | 17µg | 2% |
| Manganese | 0.054mg | 2% | |
| Vitamin B2 | 0.05mg | 0.027mg | 2% |
| Vitamin K | 0.4µg | 2.2µg | 2% |
| Folate | 14µg | 5µg | 2% |
| Fructose | 1.37g | 2% | |
| Calories | 66kcal | 44kcal | 1% |
| Calcium | 14mg | 6mg | 1% |
| Zinc | 0.1mg | 0.17mg | 1% |
| Sodium | 14mg | 0mg | 1% |
| Selenium | 0.6µg | 0µg | 1% |
| Vitamin B3 | 0.9mg | 1.125mg | 1% |
| Vitamin B5 | 0.253mg | 0.185mg | 1% |
| Protein | 1g | 1.06g | 0% |
| Protein per 100 calories | 1.5g | 2.4g | N/A |
| Calories per 10 g protein | 660kcal | 415kcal | N/A |
| Weight per 100 calories | 152g | 227g | N/A |
| Fats | 0.3g | 0.32g | 0% |
| Net carbs | 13.54g | 8.85g | N/A |
| Sugar | 13.54g | 7.89g | N/A |
| Copper | 0.086mg | 0.086mg | 0% |
| Starch | 0.07g | 0% | |
| Phosphorus | 27mg | 26mg | 0% |
| Choline | 7.6mg | 6.2mg | 0% |
| Saturated fat | 0.051g | 0.025g | 0% |
| Monounsaturated fat | 0.09g | 0.088g | 0% |
| Polyunsaturated fat | 0.069g | 0.113g | 0% |
| Tryptophan | 0.011mg | 0.005mg | 0% |
| Threonine | 0.009mg | 0% | |
| Isoleucine | 0.009mg | 0% | |
| Leucine | 0.014mg | 0% | |
| Lysine | 0.06mg | 0.016mg | 0% |
| Methionine | 0.007mg | 0.006mg | 0% |
| Phenylalanine | 0.021mg | 0% | |
| Valine | 0.013mg | 0% | |
| Histidine | 0.008mg | 0% |
Macronutrient Comparison
Macronutrient breakdown side-by-side comparison
| Contains more CarbsCarbs | +59.6% |
| Contains more OtherOther | +45.8% |
~equal in
Protein
~1.06g
~equal in
Fats
~0.32g
~equal in
Water
~87.59g
Fat Type Comparison
Fat type breakdown side-by-side comparison
| Contains less Sat. FatSaturated fat | -51% |
| Contains more Poly. FatPolyunsaturated fat | +63.8% |
~equal in
Monounsaturated fat
~0.088g


