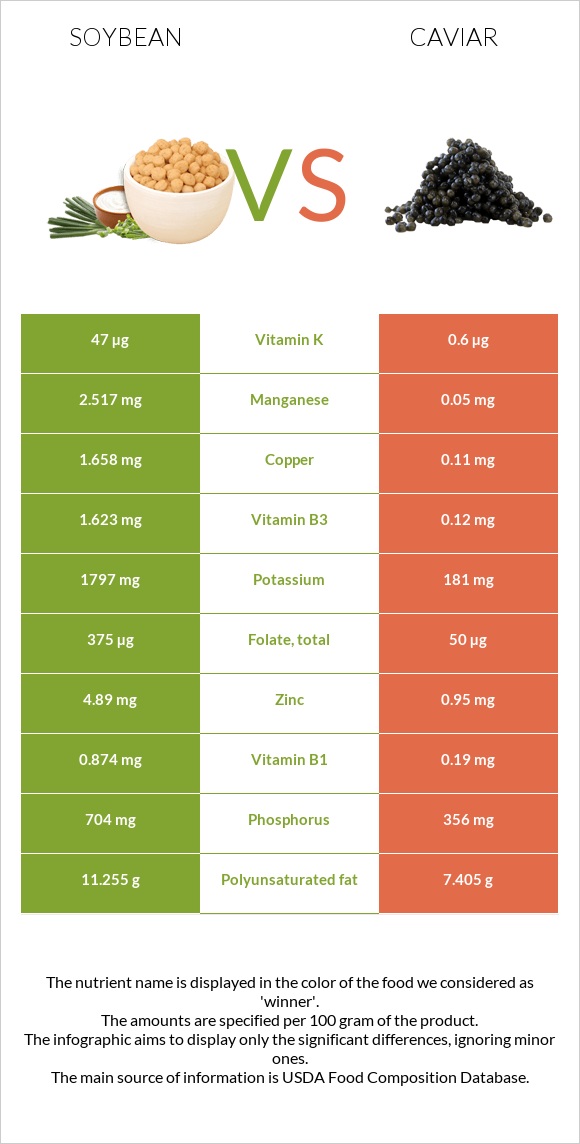
Differences between soybeans and caviar Soybeans have more manganese and copper, while caviar has more vitamin B12, selenium, iron, choline, vitamin B5, and magnesium. Caviar's daily need coverage for vitamin B12 is 833% higher. Caviar contains 16 times less manganese than soybeans. Soybeans contain 0.824mg of manganese, while caviar contains 0.05mg. The amount of sodium in soybeans is lower. Caviar has a lower glycemic index. The glycemic index of caviar is 0, while the glycemic index of soybeans is 14. The food types used in this comparison are Soybeans, mature cooked, boiled, without salt and Fish, caviar, black, and red, granular .
Infographic
Mineral Comparison
Mineral comparison score is based on the number of minerals by which one or the other food is richer. The "coverage" charts below show how much of the daily needs can be covered by 300 grams of the food.
5
100 g
300 g
1 tbsp - 10.7g 1 cup - 172g
Magnesium
Magnesium
Calcium
Calcium
Potassium
Potassium
Iron
Iron
Copper
Copper
Zinc
Zinc
Phosphorus
Phosphorus
Sodium
Sodium
Manganese
Manganese
Selenium
Selenium
61%
31%
45%
193%
136%
31%
105%
0.13%
107%
40%
5
100 g
300 g
1 tbsp - 16g 1 oz - 28.35g
Magnesium
Magnesium
Calcium
Calcium
Potassium
Potassium
Iron
Iron
Copper
Copper
Zinc
Zinc
Phosphorus
Phosphorus
Sodium
Sodium
Manganese
Manganese
Selenium
Selenium
214%
83%
16%
446%
37%
26%
153%
196%
6.5%
357%
Vitamin Comparison
Vitamin comparison score is based on the number of vitamins by which one or the other food is richer. The "coverage" charts below show how much of the daily needs can be covered by 300 grams of the food.
3
100 g
300 g
1 tbsp - 10.7g 1 cup - 172g
Vitamin C
Vit. C
Vitamin D
Vit. D
Vitamin A
Vit. A
Vitamin E
Vit. E
Vitamin B1
Vit. B1
Vitamin B2
Vit. B2
Vitamin B3
Vit. B3
Vitamin B5
Vit. B5
Vitamin B6
Vit. B6
Vitamin B12
Vit. B12
Vitamin K
Vit. K
Folate
Folate
5.7%
0%
0%
7%
39%
66%
7.5%
11%
54%
0%
48%
41%
8
100 g
300 g
1 tbsp - 16g 1 oz - 28.35g
Vitamin C
Vit. C
Vitamin D
Vit. D
Vitamin A
Vit. A
Vitamin E
Vit. E
Vitamin B1
Vit. B1
Vitamin B2
Vit. B2
Vitamin B3
Vit. B3
Vitamin B5
Vit. B5
Vitamin B6
Vit. B6
Vitamin B12
Vit. B12
Vitamin K
Vit. K
Folate
Folate
0%
44%
90%
38%
48%
143%
2.3%
210%
74%
2500%
1.5%
38%
All nutrients comparison - raw data values
Nutrient
DV% diff.
Vitamin B12
0µg
20µg
833%
Cholesterol
0mg
588mg
196%
Selenium
7.3µg
65.5µg
106%
Iron
5.14mg
11.88mg
84%
Choline
47.5mg
490.9mg
81%
Vitamin B5
0.179mg
3.5mg
66%
Sodium
1mg
1500mg
65%
Magnesium
86mg
300mg
51%
Manganese
0.824mg
0.05mg
34%
Copper
0.407mg
0.11mg
33%
Vitamin A
0µg
271µg
30%
Vitamin B2
0.285mg
0.62mg
26%
Fiber
6g
0g
24%
Calcium
102mg
275mg
17%
Phosphorus
245mg
356mg
16%
Vitamin K
19.2µg
0.6µg
16%
Polyunsaturated fat
5.064g
7.405g
16%
Vitamin D*
0 IU
117 IU
15%
Vitamin D
0µg
2.9µg
15%
Fats
8.97g
17.9g
14%
Protein
18.21g
24.6g
13%
Saturated fat
1.297g
4.06g
13%
Potassium
515mg
181mg
10%
Vitamin E
0.35mg
1.89mg
10%
Vitamin B6
0.234mg
0.32mg
7%
Monounsaturated fat
1.981g
4.631g
7%
Calories
172kcal
264kcal
5%
Vitamin B1
0.155mg
0.19mg
3%
Vitamin C
1.7mg
0mg
2%
Zinc
1.15mg
0.95mg
2%
Vitamin B3
0.399mg
0.12mg
2%
Carbs
8.36g
4g
1%
Folate
54µg
50µg
1%
Protein per 100 calories
11g
9.3g
N/A
Calories per 10 g protein
94kcal
107kcal
N/A
Weight per 100 calories
58g
38g
N/A
Unsaturated / Saturated Fat ratio
5.4
3
N/A
Net carbs
2.36g
4g
N/A
Sugar
3g
0g
N/A
Tryptophan
0.242mg
0.323mg
0%
Threonine
0.723mg
1.263mg
0%
Isoleucine
0.807mg
1.035mg
0%
Leucine
1.355mg
2.133mg
0%
Lysine
1.108mg
1.834mg
0%
Methionine
0.224mg
0.646mg
0%
Phenylalanine
0.869mg
1.071mg
0%
Valine
0.831mg
1.263mg
0%
Histidine
0.449mg
0.649mg
0%
Omega-3 - EPA
0g
2.741g
N/A
Omega-3 - DHA
0g
3.8g
N/A
Omega-3 - DPA
0g
0.229g
N/A
Macronutrient Comparison
Macronutrient breakdown side-by-side comparison
2
18%
9%
8%
63%
2%
Protein:
18.21 g
Fats:
8.97 g
Carbs:
8.36 g
Water:
62.55 g
Other:
1.91 g
3
25%
18%
4%
48%
6%
Protein:
24.6 g
Fats:
17.9 g
Carbs:
4 g
Water:
47.5 g
Other:
6 g
Contains
more
Carbs Carbs
+109%
Contains
more
Water Water
+31.7%
Contains
more
Protein Protein
+35.1%
Contains
more
Fats Fats
+99.6%
Contains
more
Other Other
+214.1%
Fat Type Comparison
Fat type breakdown side-by-side comparison
1
16%
24%
61%
Saturated fat:
Sat. Fat
1.297 g
Monounsaturated fat:
Mono. Fat
1.981 g
Polyunsaturated fat:
Poly. Fat
5.064 g
2
25%
29%
46%
Saturated fat:
Sat. Fat
4.06 g
Monounsaturated fat:
Mono. Fat
4.631 g
Polyunsaturated fat:
Poly. Fat
7.405 g
Contains
less
Sat. Fat Saturated fat
-68.1%
Contains
more
Mono. Fat Monounsaturated fat
+133.8%
Contains
more
Poly. Fat Polyunsaturated fat
+46.2%