Spaghetti sauce vs. Tomato soup — In-Depth Nutrition Comparison
Compare
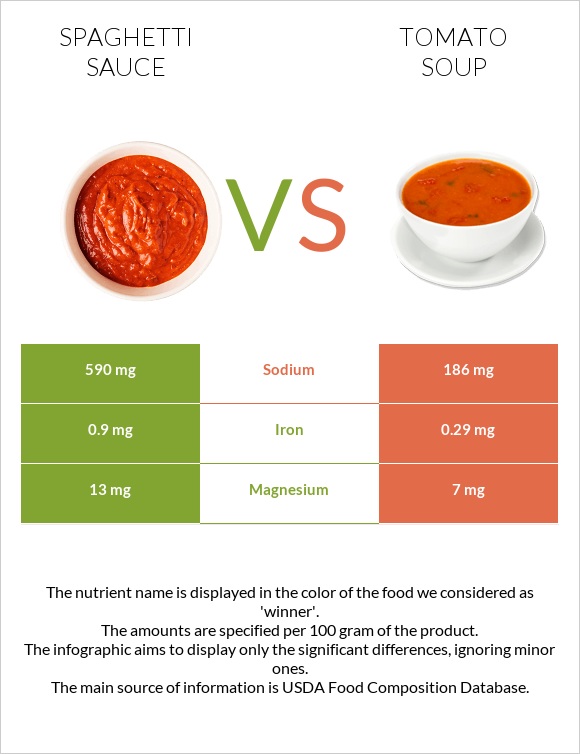
Important differences between spaghetti sauce and tomato soup
- Tomato soup has less vitamin B2 and iron.
- Spaghetti sauce's daily need coverage for sodium is 18% more.
- Spaghetti sauce has 17 times more vitamin B2 than tomato soup. Spaghetti sauce has 0.12mg of vitamin B2, while tomato soup has 0.007mg.
- Tomato soup is lower in sodium.
The food varieties used in the comparison are USDA Commodity, spaghetti sauce, meatless, canned and Soup, tomato, canned, prepared with equal volume water, commercial.
Infographic
Infographic link
Mineral Comparison
Mineral comparison score is based on the number of minerals by which one or the other food is richer. The "coverage" charts below show how much of the daily needs can be covered by 300 grams of the food.
| Contains more MagnesiumMagnesium | +85.7% |
| Contains more CalciumCalcium | +150% |
| Contains more IronIron | +210.3% |
| Contains more ZincZinc | +133.3% |
| Contains more PhosphorusPhosphorus | +66.7% |
| Contains less SodiumSodium | -68.5% |
Vitamin Comparison
Vitamin comparison score is based on the number of vitamins by which one or the other food is richer. The "coverage" charts below show how much of the daily needs can be covered by 300 grams of the food.
| Contains more Vitamin AVitamin A | +70% |
| Contains more Vitamin B1Vitamin B1 | +50% |
| Contains more Vitamin B2Vitamin B2 | +1614.3% |
| Contains more Vitamin B3Vitamin B3 | +73.8% |
| Contains more Vitamin B6Vitamin B6 | +42.9% |
| Contains more Vitamin CVitamin C | +61.5% |
All nutrients comparison - raw data values
| Nutrient |  |
 |
DV% diff. |
| Sodium | 590mg | 186mg | 18% |
| Vitamin B2 | 0.12mg | 0.007mg | 9% |
| Iron | 0.9mg | 0.29mg | 8% |
| Vitamin C | 3.9mg | 6.3mg | 3% |
| Copper | 0.029mg | 3% | |
| Manganese | 0.067mg | 3% | |
| Selenium | 1.5µg | 3% | |
| Polyunsaturated fat | 0.51g | 0.077g | 3% |
| Fiber | 0.5g | 2% | |
| Vitamin B3 | 0.73mg | 0.42mg | 2% |
| Fructose | 1.8g | 2% | |
| Calories | 48kcal | 32kcal | 1% |
| Protein | 1.2g | 0.71g | 1% |
| Fats | 0.9g | 0.21g | 1% |
| Magnesium | 13mg | 7mg | 1% |
| Calcium | 20mg | 8mg | 1% |
| Potassium | 292mg | 275mg | 1% |
| Zinc | 0.21mg | 0.09mg | 1% |
| Phosphorus | 25mg | 15mg | 1% |
| Vitamin A | 17µg | 10µg | 1% |
| Vitamin E | 0.17mg | 1% | |
| Vitamin B1 | 0.03mg | 0.02mg | 1% |
| Vitamin B6 | 0.06mg | 0.042mg | 1% |
| Vitamin K | 1.5µg | 1% | |
| Choline | 6.3mg | 1% | |
| Protein per 100 calories | 2.5g | 2.2g | N/A |
| Calories per 10 g protein | 400kcal | 451kcal | N/A |
| Weight per 100 calories | 208g | 313g | N/A |
| Net carbs | 8.7g | 6.95g | N/A |
| Carbs | 8.7g | 7.45g | 0% |
| Sugar | 4.7g | 4.03g | N/A |
| Saturated fat | 0.162g | 0.056g | 0% |
| Monounsaturated fat | 0.21g | 0.067g | 0% |
Macronutrient Comparison
Macronutrient breakdown side-by-side comparison
Protein:
1.2 g
Fats:
0.9 g
Carbs:
8.7 g
Water:
87.1 g
Other:
2.1 g
Protein:
0.71 g
Fats:
0.21 g
Carbs:
7.45 g
Water:
90.55 g
Other:
1.08 g
| Contains more ProteinProtein | +69% |
| Contains more FatsFats | +328.6% |
| Contains more CarbsCarbs | +16.8% |
| Contains more OtherOther | +94.4% |
~equal in
Water
~90.55g
Fat Type Comparison
Fat type breakdown side-by-side comparison
Saturated fat:
Sat. Fat
0.162 g
Monounsaturated fat:
Mono. Fat
0.21 g
Polyunsaturated fat:
Poly. Fat
0.51 g
Saturated fat:
Sat. Fat
0.056 g
Monounsaturated fat:
Mono. Fat
0.067 g
Polyunsaturated fat:
Poly. Fat
0.077 g
| Contains more Mono. FatMonounsaturated fat | +213.4% |
| Contains more Poly. FatPolyunsaturated fat | +562.3% |
| Contains less Sat. FatSaturated fat | -65.4% |


