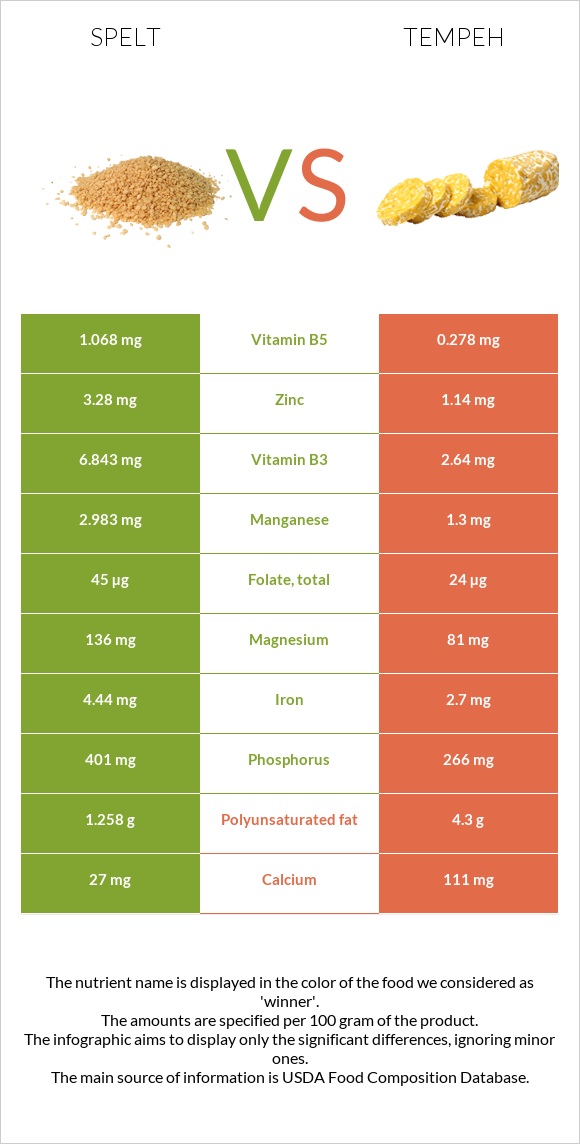
A recap on the differences between spelt and tempeh Spelt has more selenium; however, tempeh is higher in copper, vitamin B2, phosphorus, iron, vitamin B6, calcium, manganese, potassium, and magnesium. Tempeh covers your daily copper needs 38% more than spelt. The glycemic index of spelt is higher. Food varieties used in this article are Spelt, cooked and Tempeh .
Infographic
Mineral Comparison
Mineral comparison score is based on the number of minerals by which one or the other food is richer. The "coverage" charts below show how much of the daily needs can be covered by 300 grams of the food.
2
100 g
300 g
1 cup - 194g
Magnesium
Magnesium
Calcium
Calcium
Potassium
Potassium
Iron
Iron
Copper
Copper
Zinc
Zinc
Phosphorus
Phosphorus
Sodium
Sodium
Manganese
Manganese
Selenium
Selenium
35%
3%
13%
63%
72%
34%
64%
0.65%
142%
22%
7
100 g
300 g
1 cup - 166g
Magnesium
Magnesium
Calcium
Calcium
Potassium
Potassium
Iron
Iron
Copper
Copper
Zinc
Zinc
Phosphorus
Phosphorus
Sodium
Sodium
Manganese
Manganese
Selenium
Selenium
58%
33%
36%
101%
187%
31%
114%
1.2%
170%
0%
Vitamin Comparison
Vitamin comparison score is based on the number of vitamins by which one or the other food is richer. The "coverage" charts below show how much of the daily needs can be covered by 300 grams of the food.
2
100 g
300 g
1 cup - 194g
Vitamin C
Vit. C
Vitamin D
Vit. D
Vitamin A
Vit. A
Vitamin E
Vit. E
Vitamin B1
Vit. B1
Vitamin B2
Vit. B2
Vitamin B3
Vit. B3
Vitamin B5
Vit. B5
Vitamin B6
Vit. B6
Vitamin B12
Vit. B12
Vitamin K
Vit. K
Folate
Folate
0%
0%
0%
5.2%
26%
6.9%
48%
0%
18%
0%
0%
9.8%
5
100 g
300 g
1 cup - 166g
Vitamin C
Vit. C
Vitamin D
Vit. D
Vitamin A
Vit. A
Vitamin E
Vit. E
Vitamin B1
Vit. B1
Vitamin B2
Vit. B2
Vitamin B3
Vit. B3
Vitamin B5
Vit. B5
Vitamin B6
Vit. B6
Vitamin B12
Vit. B12
Vitamin K
Vit. K
Folate
Folate
0%
0%
0%
0%
20%
83%
50%
17%
50%
10%
0%
18%
All nutrients comparison - raw data values
Nutrient
DV% diff.
Copper
0.215mg
0.56mg
38%
Protein
5.5g
20.29g
30%
Polyunsaturated fat
4.3g
29%
Vitamin B2
0.03mg
0.358mg
25%
Phosphorus
150mg
266mg
17%
Fiber
3.9g
16%
Fats
0.85g
10.8g
15%
Iron
1.67mg
2.7mg
13%
Saturated fat
2.539g
12%
Calcium
10mg
111mg
10%
Vitamin B6
0.08mg
0.215mg
10%
Manganese
1.091mg
1.3mg
9%
Magnesium
49mg
81mg
8%
Potassium
143mg
412mg
8%
Starch
19.57g
8%
Monounsaturated fat
3.205g
8%
Selenium
4µg
0µg
7%
Carbs
26.44g
7.64g
6%
Vitamin B5
0.278mg
6%
Calories
127kcal
192kcal
3%
Vitamin B12
0µg
0.08µg
3%
Folate
13µg
24µg
3%
Vitamin E
0.26mg
2%
Vitamin B1
0.103mg
0.078mg
2%
Zinc
1.25mg
1.14mg
1%
Protein per 100 calories
4.3g
11g
N/A
Calories per 10 g protein
231kcal
95kcal
N/A
Weight per 100 calories
79g
52g
N/A
Unsaturated / Saturated Fat ratio
3
N/A
Net carbs
22.54g
7.64g
N/A
Sodium
5mg
9mg
0%
Vitamin B3
2.57mg
2.64mg
0%
Tryptophan
0.194mg
0%
Threonine
0.796mg
0%
Isoleucine
0.88mg
0%
Leucine
1.43mg
0%
Lysine
0.908mg
0%
Methionine
0.175mg
0%
Phenylalanine
0.893mg
0%
Valine
0.92mg
0%
Histidine
0.466mg
0%
Macronutrient Comparison
Macronutrient breakdown side-by-side comparison
2
6%
26%
67%
Protein:
5.5 g
Fats:
0.85 g
Carbs:
26.44 g
Water:
66.56 g
Other:
0.65 g
3
20%
11%
8%
60%
Protein:
20.29 g
Fats:
10.8 g
Carbs:
7.64 g
Water:
59.65 g
Other:
1.62 g
Contains
more
Carbs Carbs
+246.1%
Contains
more
Water Water
+11.6%
Contains
more
Protein Protein
+268.9%
Contains
more
Fats Fats
+1170.6%
Contains
more
Other Other
+149.2%