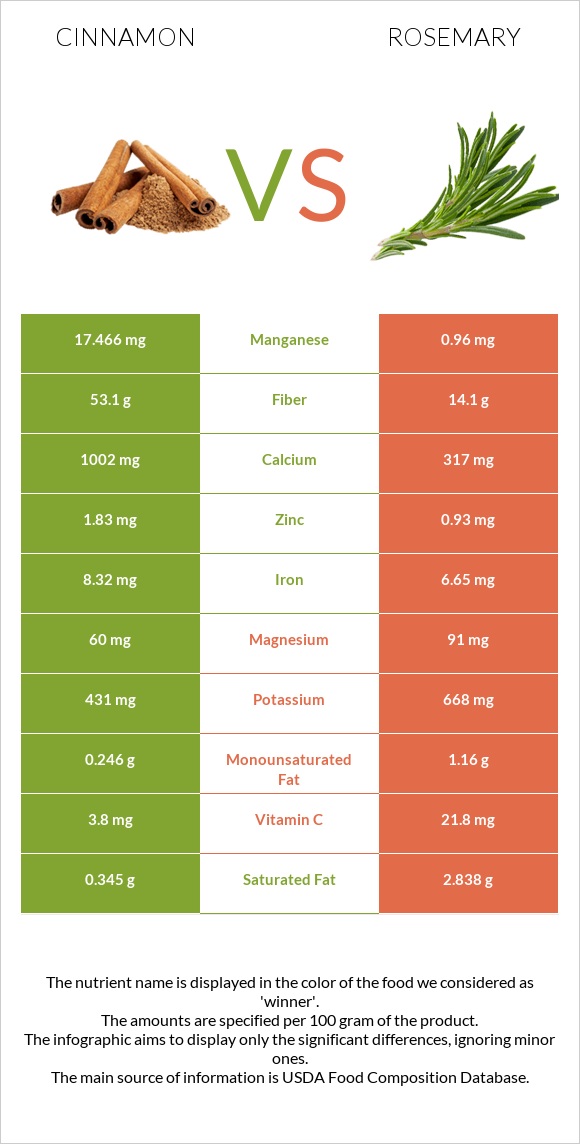
Summary of differences between cinnamon and rosemary Cinnamon has more manganese, fiber, calcium, and iron, while rosemary has more vitamin A, folate, vitamin C, vitamin B6, and vitamin B5. Cinnamon covers your daily need for manganese, 718% more than rosemary. Cinnamon contains 4 times more fiber than rosemary. While cinnamon contains 53.1g of fiber, rosemary contains only 14.1g. The amount of saturated fat in cinnamon is lower. These are the specific foods used in this comparison Spices, cinnamon, ground and Rosemary, fresh .
Infographic
Mineral Comparison
Mineral comparison score is based on the number of minerals by which one or the other food is richer. The "coverage" charts below show how much of the daily needs can be covered by 300 grams of the food.
7
100 g
300 g
0.25 tsp - 0.5g 1 tbsp - 7.8g
Magnesium
Magnesium
Calcium
Calcium
Potassium
Potassium
Iron
Iron
Copper
Copper
Zinc
Zinc
Phosphorus
Phosphorus
Sodium
Sodium
Manganese
Manganese
Selenium
Selenium
43%
301%
38%
312%
113%
50%
27%
1.3%
2278%
17%
2
100 g
300 g
1 tsp - 0.7g 1 tbsp - 1.7g
Magnesium
Magnesium
Calcium
Calcium
Potassium
Potassium
Iron
Iron
Copper
Copper
Zinc
Zinc
Phosphorus
Phosphorus
Sodium
Sodium
Manganese
Manganese
Selenium
Selenium
65%
95%
59%
249%
100%
25%
28%
3.4%
125%
0%
Vitamin Comparison
Vitamin comparison score is based on the number of vitamins by which one or the other food is richer. The "coverage" charts below show how much of the daily needs can be covered by 300 grams of the food.
3
100 g
300 g
0.25 tsp - 0.5g 1 tbsp - 7.8g
Vitamin C
Vit. C
Vitamin D
Vit. D
Vitamin A
Vit. A
Vitamin E
Vit. E
Vitamin B1
Vit. B1
Vitamin B2
Vit. B2
Vitamin B3
Vit. B3
Vitamin B5
Vit. B5
Vitamin B6
Vit. B6
Vitamin B12
Vit. B12
Vitamin K
Vit. K
Folate
Folate
13%
0%
5%
46%
5.5%
9.5%
25%
21%
36%
0%
78%
4.5%
7
100 g
300 g
1 tsp - 0.7g 1 tbsp - 1.7g
Vitamin C
Vit. C
Vitamin D
Vit. D
Vitamin A
Vit. A
Vitamin E
Vit. E
Vitamin B1
Vit. B1
Vitamin B2
Vit. B2
Vitamin B3
Vit. B3
Vitamin B5
Vit. B5
Vitamin B6
Vit. B6
Vitamin B12
Vit. B12
Vitamin K
Vit. K
Folate
Folate
73%
0%
49%
0%
9%
35%
17%
48%
78%
0%
0%
82%
All nutrients comparison - raw data values
Nutrient
DV% diff.
Manganese
17.466mg
0.96mg
718%
Fiber
53.1g
14.1g
156%
Calcium
1002mg
317mg
69%
Vitamin K
31.2µg
26%
Folate
6µg
109µg
26%
Iron
8.32mg
6.65mg
21%
Vitamin C
3.8mg
21.8mg
20%
Carbs
80.59g
20.7g
20%
Vitamin A
15µg
146µg
15%
Vitamin E
2.32mg
15%
Vitamin B6
0.158mg
0.336mg
14%
Saturated fat
0.345g
2.838g
11%
Vitamin B2
0.041mg
0.152mg
9%
Vitamin B5
0.358mg
0.804mg
9%
Zinc
1.83mg
0.93mg
8%
Fats
1.24g
5.86g
7%
Magnesium
60mg
91mg
7%
Potassium
431mg
668mg
7%
Calories
247kcal
131kcal
6%
Selenium
3.1µg
6%
Polyunsaturated fat
0.068g
0.901g
6%
Copper
0.339mg
0.301mg
4%
Vitamin B3
1.332mg
0.912mg
3%
Choline
11mg
2%
Monounsaturated fat
0.246g
1.16g
2%
Protein
3.99g
3.31g
1%
Sodium
10mg
26mg
1%
Vitamin B1
0.022mg
0.036mg
1%
Fructose
1.11g
1%
Protein per 100 calories
1.6g
2.5g
N/A
Calories per 10 g protein
619kcal
396kcal
N/A
Weight per 100 calories
40g
76g
N/A
Unsaturated / Saturated Fat ratio
0.91
0.73
N/A
Net carbs
27.49g
6.6g
N/A
Sugar
2.17g
N/A
Phosphorus
64mg
66mg
0%
Tryptophan
0.049mg
0.051mg
0%
Threonine
0.136mg
0.136mg
0%
Isoleucine
0.146mg
0.136mg
0%
Leucine
0.253mg
0.249mg
0%
Lysine
0.243mg
0.143mg
0%
Methionine
0.078mg
0.047mg
0%
Phenylalanine
0.146mg
0.169mg
0%
Valine
0.224mg
0.165mg
0%
Histidine
0.117mg
0.066mg
0%
Omega-3 - ALA
0.011g
N/A
Macronutrient Comparison
Macronutrient breakdown side-by-side comparison
3
4%
81%
11%
4%
Protein:
3.99 g
Fats:
1.24 g
Carbs:
80.59 g
Water:
10.58 g
Other:
3.6 g
2
3%
6%
21%
68%
2%
Protein:
3.31 g
Fats:
5.86 g
Carbs:
20.7 g
Water:
67.77 g
Other:
2.36 g
Contains
more
Protein Protein
+20.5%
Contains
more
Carbs Carbs
+289.3%
Contains
more
Other Other
+52.5%
Contains
more
Fats Fats
+372.6%
Contains
more
Water Water
+540.5%
Fat Type Comparison
Fat type breakdown side-by-side comparison
1
52%
37%
10%
Saturated fat:
Sat. Fat
0.345 g
Monounsaturated fat:
Mono. Fat
0.246 g
Polyunsaturated fat:
Poly. Fat
0.068 g
2
58%
24%
18%
Saturated fat:
Sat. Fat
2.838 g
Monounsaturated fat:
Mono. Fat
1.16 g
Polyunsaturated fat:
Poly. Fat
0.901 g
Contains
less
Sat. Fat Saturated fat
-87.8%
Contains
more
Mono. Fat Monounsaturated fat
+371.5%
Contains
more
Poly. Fat Polyunsaturated fat
+1225%