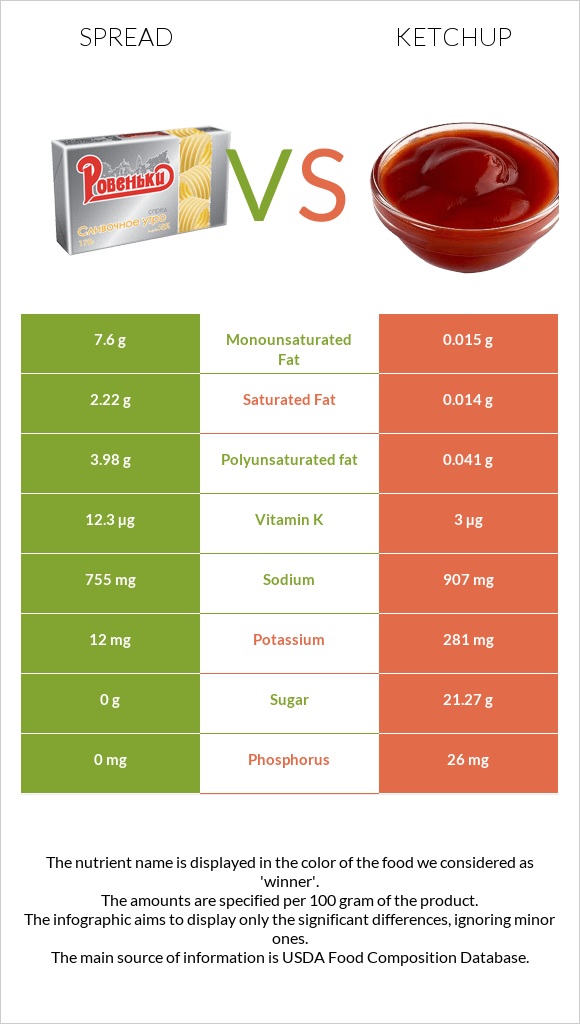
Significant differences between spread and ketchup Spread has more vitamin A, vitamin K, monounsaturated fat, and polyunsaturated fat; however, ketchup is richer in potassium. Spread covers your daily vitamin A needs 79% more than ketchup. Ketchup has 507 times less monounsaturated fat than spread. Spread has 7.6g of monounsaturated fat, while ketchup has 0.015g. Ketchup contains less saturated fat. Specific food types used in this comparison are Margarine-like spread, SMART BEAT Super Light without saturated fat and Catsup .
Infographic
Mineral Comparison
Mineral comparison score is based on the number of minerals by which one or the other food is richer. The "coverage" charts below show how much of the daily needs can be covered by 300 grams of the food.
1
100 g
300 g
1 tablespoon - 14g
Magnesium
Magnesium
Calcium
Calcium
Potassium
Potassium
Iron
Iron
Copper
Copper
Zinc
Zinc
Phosphorus
Phosphorus
Sodium
Sodium
Manganese
Manganese
Selenium
Selenium
0%
0%
1.1%
0%
0%
0%
0%
98%
0%
0%
9
100 g
300 g
1 packet - 9g 1 tbsp - 17g 1 cup - 240g
Magnesium
Magnesium
Calcium
Calcium
Potassium
Potassium
Iron
Iron
Copper
Copper
Zinc
Zinc
Phosphorus
Phosphorus
Sodium
Sodium
Manganese
Manganese
Selenium
Selenium
9.3%
4.5%
25%
13%
28%
4.6%
11%
118%
11%
3.8%
Vitamin Comparison
Vitamin comparison score is based on the number of vitamins by which one or the other food is richer. The "coverage" charts below show how much of the daily needs can be covered by 300 grams of the food.
2
100 g
300 g
1 tablespoon - 14g
Vitamin C
Vit. C
Vitamin D
Vit. D
Vitamin A
Vit. A
Vitamin E
Vit. E
Vitamin B1
Vit. B1
Vitamin B2
Vit. B2
Vitamin B3
Vit. B3
Vitamin B5
Vit. B5
Vitamin B6
Vit. B6
Vitamin B12
Vit. B12
Vitamin K
Vit. K
Folate
Folate
0%
0%
0%
34%
0%
0%
0%
0%
0%
0%
31%
0%
8
100 g
300 g
1 packet - 9g 1 tbsp - 17g 1 cup - 240g
Vitamin C
Vit. C
Vitamin D
Vit. D
Vitamin A
Vit. A
Vitamin E
Vit. E
Vitamin B1
Vit. B1
Vitamin B2
Vit. B2
Vitamin B3
Vit. B3
Vitamin B5
Vit. B5
Vitamin B6
Vit. B6
Vitamin B12
Vit. B12
Vitamin K
Vit. K
Folate
Folate
14%
0%
8.7%
29%
2.8%
38%
27%
2.8%
36%
0%
7.5%
6.8%
All nutrients comparison - raw data values
Nutrient
DV% diff.
Fats
17.1g
0.1g
26%
Polyunsaturated fat
3.98g
0.041g
26%
Monounsaturated fat
7.6g
0.015g
19%
Vitamin B2
0.166mg
13%
Vitamin B6
0.158mg
12%
Fructose
8.72g
11%
Saturated fat
2.22g
0.014g
10%
Carbs
0g
27.4g
9%
Copper
0.085mg
9%
Vitamin B3
1.434mg
9%
Potassium
12mg
281mg
8%
Vitamin K
12.3µg
3µg
8%
Sodium
755mg
907mg
7%
Vitamin C
4.1mg
5%
Iron
0.35mg
4%
Phosphorus
0mg
26mg
4%
Manganese
0.084mg
4%
Calories
158kcal
101kcal
3%
Magnesium
13mg
3%
Vitamin A
26µg
3%
Protein
0g
1.04g
2%
Calcium
15mg
2%
Zinc
0.17mg
2%
Vitamin E
1.7mg
1.46mg
2%
Folate
9µg
2%
Choline
12.5mg
2%
Fiber
0g
0.3g
1%
Selenium
0.7µg
1%
Vitamin B1
0.011mg
1%
Vitamin B5
0.047mg
1%
Protein per 100 calories
0g
1g
N/A
Calories per 10 g protein
971kcal
N/A
Weight per 100 calories
63g
99g
N/A
Unsaturated / Saturated Fat ratio
5.2
4
N/A
Net carbs
0g
27.1g
N/A
Sugar
0g
21.27g
N/A
Trans fat
2.45g
0g
N/A
Tryptophan
0.005mg
0%
Threonine
0.019mg
0%
Isoleucine
0.014mg
0%
Leucine
0.021mg
0%
Lysine
0.023mg
0%
Methionine
0.005mg
0%
Phenylalanine
0.021mg
0%
Valine
0.014mg
0%
Histidine
0.013mg
0%
Macronutrient Comparison
Macronutrient breakdown side-by-side comparison
2
17%
81%
2%
Protein:
0 g
Fats:
17.1 g
Carbs:
0 g
Water:
80.83 g
Other:
2.07 g
3
27%
69%
3%
Protein:
1.04 g
Fats:
0.1 g
Carbs:
27.4 g
Water:
68.51 g
Other:
2.95 g
Contains
more
Fats Fats
+17000%
Contains
more
Water Water
+18%
Contains
more
Protein Protein
+∞%
Contains
more
Carbs Carbs
+∞%
Contains
more
Other Other
+42.5%
Fat Type Comparison
Fat type breakdown side-by-side comparison
2
16%
55%
29%
Saturated fat:
Sat. Fat
2.22 g
Monounsaturated fat:
Mono. Fat
7.6 g
Polyunsaturated fat:
Poly. Fat
3.98 g
1
20%
21%
59%
Saturated fat:
Sat. Fat
0.014 g
Monounsaturated fat:
Mono. Fat
0.015 g
Polyunsaturated fat:
Poly. Fat
0.041 g
Contains
more
Mono. Fat Monounsaturated fat
+50566.7%
Contains
more
Poly. Fat Polyunsaturated fat
+9607.3%
Contains
less
Sat. Fat Saturated fat
-99.4%