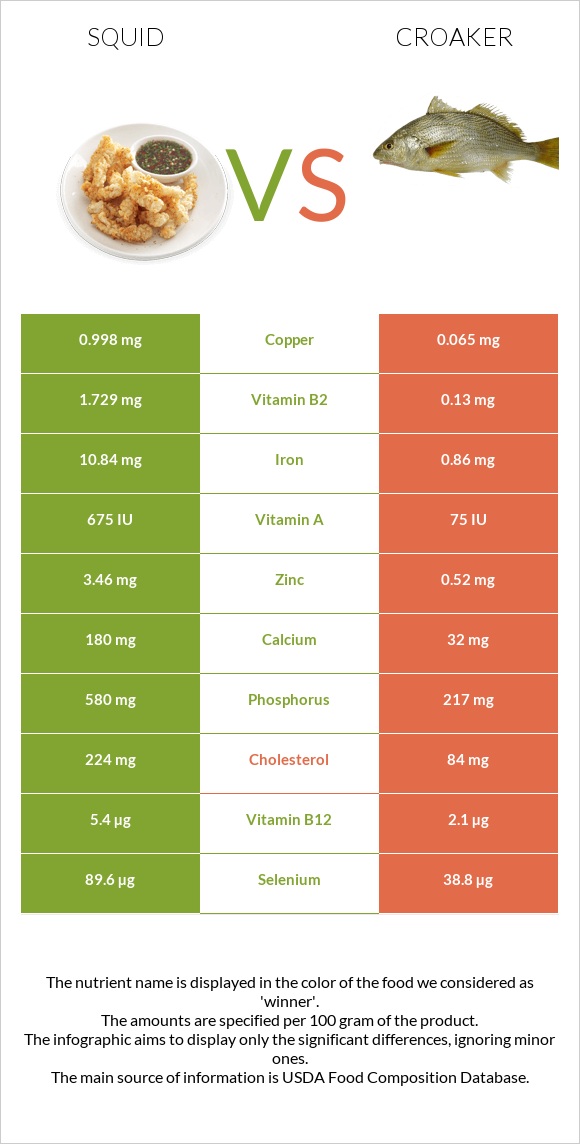
Significant differences between squid and croaker The amount of vitamin B12, iron, vitamin B2, copper, selenium, phosphorus, and zinc in squid is higher than in croaker. Squid covers your daily vitamin B12 needs 138% more than croaker. Croaker has 15 times less copper than squid. Squid has 0.998mg of copper, while croaker has 0.065mg. Croaker contains less cholesterol. Specific food types used in this comparison are Mollusks, cuttlefish, mixed species, cooked, moist heat and Fish, croaker, Atlantic, cooked, breaded, and fried .
Infographic
Mineral Comparison
Mineral comparison score is based on the number of minerals by which one or the other food is richer. The "coverage" charts below show how much of the daily needs can be covered by 300 grams of the food.
9
100 g
300 g
3 oz - 85g
Magnesium
Magnesium
Calcium
Calcium
Potassium
Potassium
Iron
Iron
Copper
Copper
Zinc
Zinc
Phosphorus
Phosphorus
Sodium
Sodium
Manganese
Manganese
Selenium
Selenium
43%
54%
56%
407%
333%
94%
249%
97%
27%
489%
1
100 g
300 g
3 oz - 85g 1 fillet - 87g
Magnesium
Magnesium
Calcium
Calcium
Potassium
Potassium
Iron
Iron
Copper
Copper
Zinc
Zinc
Phosphorus
Phosphorus
Sodium
Sodium
Manganese
Manganese
Selenium
Selenium
30%
9.6%
30%
32%
22%
14%
93%
45%
10%
212%
Vitamin Comparison
Vitamin comparison score is based on the number of vitamins by which one or the other food is richer. The "coverage" charts below show how much of the daily needs can be covered by 300 grams of the food.
5
100 g
300 g
3 oz - 85g
Vitamin C
Vit. C
Vitamin D
Vit. D
Vitamin A
Vit. A
Vitamin E
Vit. E
Vitamin B1
Vit. B1
Vitamin B2
Vit. B2
Vitamin B3
Vit. B3
Vitamin B5
Vit. B5
Vitamin B6
Vit. B6
Vitamin B12
Vit. B12
Vitamin K
Vit. K
Folate
Folate
28%
0%
68%
0%
4.3%
399%
41%
54%
62%
675%
0%
18%
3
100 g
300 g
3 oz - 85g 1 fillet - 87g
Vitamin C
Vit. C
Vitamin D
Vit. D
Vitamin A
Vit. A
Vitamin E
Vit. E
Vitamin B1
Vit. B1
Vitamin B2
Vit. B2
Vitamin B3
Vit. B3
Vitamin B5
Vit. B5
Vitamin B6
Vit. B6
Vitamin B12
Vit. B12
Vitamin K
Vit. K
Folate
Folate
0%
0%
7.7%
0%
23%
30%
81%
44%
60%
263%
0%
26%
All nutrients comparison - raw data values
Nutrient
DV% diff.
Vitamin B12
5.4µg
2.1µg
138%
Iron
10.84mg
0.86mg
125%
Vitamin B2
1.729mg
0.13mg
123%
Copper
0.998mg
0.065mg
104%
Selenium
89.6µg
38.8µg
92%
Phosphorus
580mg
217mg
52%
Cholesterol
224mg
84mg
47%
Protein
32.48g
18.2g
29%
Zinc
3.46mg
0.52mg
27%
Vitamin A
203µg
23µg
20%
Polyunsaturated fat
0.268g
2.917g
18%
Fats
1.4g
12.67g
17%
Sodium
744mg
348mg
17%
Calcium
180mg
32mg
15%
Saturated fat
0.236g
3.476g
15%
Vitamin B3
2.189mg
4.3mg
13%
Monounsaturated fat
0.162g
5.32g
13%
Vitamin C
8.5mg
0mg
9%
Potassium
637mg
340mg
9%
Manganese
0.209mg
0.08mg
6%
Vitamin B1
0.017mg
0.09mg
6%
Magnesium
60mg
42mg
4%
Calories
158kcal
221kcal
3%
Vitamin B5
0.9mg
0.74mg
3%
Folate
24µg
34µg
3%
Carbs
1.64g
7.54g
2%
Fiber
0g
0.4g
2%
Vitamin B6
0.27mg
0.26mg
1%
Protein per 100 calories
21g
8.2g
N/A
Calories per 10 g protein
49kcal
121kcal
N/A
Weight per 100 calories
63g
45g
N/A
Unsaturated / Saturated Fat ratio
1.8
2.4
N/A
Net carbs
1.64g
7.14g
N/A
Tryptophan
0.364mg
0.208mg
0%
Threonine
1.398mg
0.788mg
0%
Isoleucine
1.414mg
0.847mg
0%
Leucine
2.287mg
1.48mg
0%
Lysine
2.427mg
1.571mg
0%
Methionine
0.733mg
0.525mg
0%
Phenylalanine
1.164mg
0.742mg
0%
Valine
1.419mg
0.947mg
0%
Histidine
0.624mg
0.525mg
0%
Omega-3 - EPA
0.078g
0.113g
N/A
Omega-3 - DHA
0.132g
0.089g
N/A
Omega-3 - DPA
0.012g
0.079g
N/A
Macronutrient Comparison
Macronutrient breakdown side-by-side comparison
3
32%
61%
3%
Protein:
32.48 g
Fats:
1.4 g
Carbs:
1.64 g
Water:
61.12 g
Other:
3.36 g
2
18%
13%
8%
60%
2%
Protein:
18.2 g
Fats:
12.67 g
Carbs:
7.54 g
Water:
59.76 g
Other:
1.83 g
Contains
more
Protein Protein
+78.5%
Contains
more
Other Other
+83.6%
Contains
more
Fats Fats
+805%
Contains
more
Carbs Carbs
+359.8%
Fat Type Comparison
Fat type breakdown side-by-side comparison
1
35%
24%
40%
Saturated fat:
Sat. Fat
0.236 g
Monounsaturated fat:
Mono. Fat
0.162 g
Polyunsaturated fat:
Poly. Fat
0.268 g
2
30%
45%
25%
Saturated fat:
Sat. Fat
3.476 g
Monounsaturated fat:
Mono. Fat
5.32 g
Polyunsaturated fat:
Poly. Fat
2.917 g
Contains
less
Sat. Fat Saturated fat
-93.2%
Contains
more
Mono. Fat Monounsaturated fat
+3184%
Contains
more
Poly. Fat Polyunsaturated fat
+988.4%