Strudel vs. Biscuit — In-Depth Nutrition Comparison
Compare
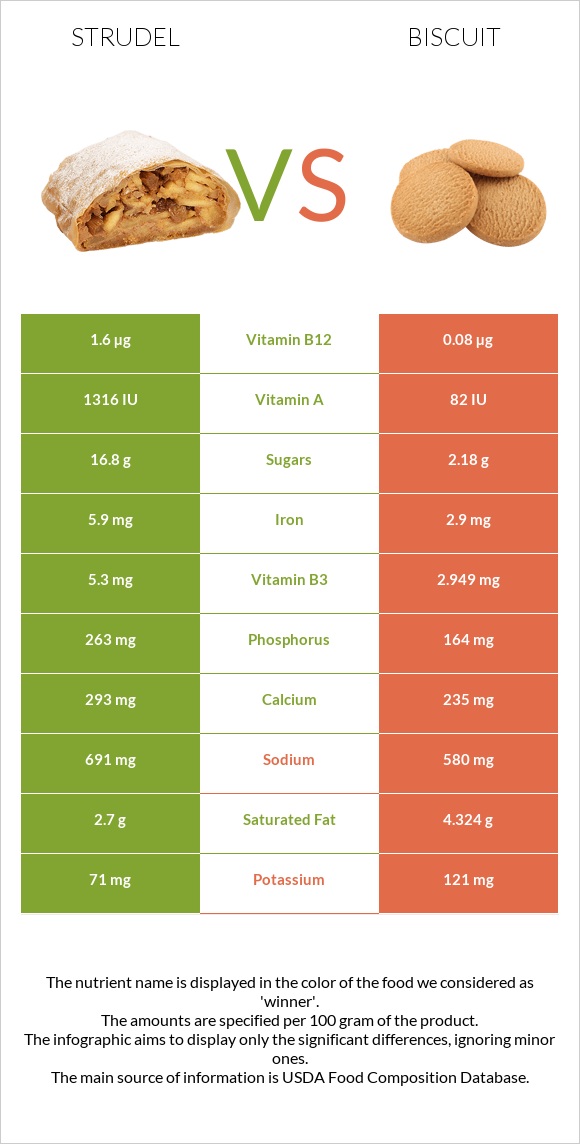
The main differences between strudel and biscuits
- Strudel is richer than biscuits in vitamin B12, vitamin B6, iron, vitamin A, vitamin B3, phosphorus, vitamin B2, and calcium.
- Daily need coverage for vitamin B12 for strudel is 63% higher.
- Strudel contains 16 times more vitamin A than biscuits. Strudel contains 1316 IU of vitamin A, while biscuits contain 82 IU.
- Biscuits contain less sodium.
- Biscuits have a lower glycemic index than strudel.
Food types used in this article are KELLOGG'S, EGGO, Wafflers, Strawberry Strudel and Biscuits, plain or buttermilk, prepared from recipe.
Infographic
Infographic link
Mineral Comparison
Mineral comparison score is based on the number of minerals by which one or the other food is richer. The "coverage" charts below show how much of the daily needs can be covered by 300 grams of the food.
| Contains more CalciumCalcium | +24.7% |
| Contains more IronIron | +103.4% |
| Contains more PhosphorusPhosphorus | +60.4% |
| Contains more MagnesiumMagnesium | +38.5% |
| Contains more PotassiumPotassium | +70.4% |
| Contains more ZincZinc | +35% |
| Contains less SodiumSodium | -16.1% |
Vitamin Comparison
Vitamin comparison score is based on the number of vitamins by which one or the other food is richer. The "coverage" charts below show how much of the daily needs can be covered by 300 grams of the food.
| Contains more Vitamin AVitamin A | +∞% |
| Contains more Vitamin B2Vitamin B2 | +45.2% |
| Contains more Vitamin B3Vitamin B3 | +79.7% |
| Contains more Vitamin B6Vitamin B6 | +1414.3% |
| Contains more Vitamin B12Vitamin B12 | +1900% |
| Contains more FolateFolate | +21.3% |
All nutrients comparison - raw data values
| Nutrient |  |
 |
DV% diff. |
| Vitamin B12 | 1.6µg | 0.08µg | 63% |
| Vitamin A | 395µg | 44% | |
| Iron | 5.9mg | 2.9mg | 38% |
| Vitamin B6 | 0.53mg | 0.035mg | 38% |
| Selenium | 19.5µg | 35% | |
| Manganese | 0.378mg | 16% | |
| Vitamin B3 | 5.3mg | 2.949mg | 15% |
| Phosphorus | 263mg | 164mg | 14% |
| Vitamin B2 | 0.45mg | 0.31mg | 11% |
| Monounsaturated fat | 2.8g | 6.93g | 10% |
| Copper | 0.082mg | 9% | |
| Fats | 11g | 16.3g | 8% |
| Saturated fat | 2.7g | 4.324g | 7% |
| Calcium | 293mg | 235mg | 6% |
| Vitamin B5 | 0.285mg | 6% | |
| Sodium | 691mg | 580mg | 5% |
| Protein | 5g | 7g | 4% |
| Cholesterol | 12mg | 3mg | 3% |
| Vitamin B1 | 0.39mg | 0.356mg | 3% |
| Folate | 74µg | 61µg | 3% |
| Polyunsaturated fat | 4.6g | 4.163g | 3% |
| Calories | 318kcal | 353kcal | 2% |
| Carbs | 50g | 44.6g | 2% |
| Magnesium | 13mg | 18mg | 1% |
| Potassium | 71mg | 121mg | 1% |
| Fiber | 1.2g | 1.5g | 1% |
| Zinc | 0.4mg | 0.54mg | 1% |
| Vitamin C | 0.2mg | 0% | |
| Net carbs | 48.8g | 43.1g | N/A |
| Vitamin D | 1 IU | 0% | |
| Sugar | 16.8g | 2.18g | N/A |
| Trans fat | 0.2g | N/A | |
| Tryptophan | 0.087mg | 0% | |
| Threonine | 0.211mg | 0% | |
| Isoleucine | 0.273mg | 0% | |
| Leucine | 0.514mg | 0% | |
| Lysine | 0.226mg | 0% | |
| Methionine | 0.132mg | 0% | |
| Phenylalanine | 0.347mg | 0% | |
| Valine | 0.313mg | 0% | |
| Histidine | 0.161mg | 0% |
Macronutrient Comparison
Macronutrient breakdown side-by-side comparison
| Contains more CarbsCarbs | +12.1% |
| Contains more OtherOther | +50% |
| Contains more ProteinProtein | +40% |
| Contains more FatsFats | +48.2% |
~equal in
Water
~28.9g
Fat Type Comparison
Fat type breakdown side-by-side comparison
| Contains less Sat. FatSaturated fat | -37.6% |
| Contains more Mono. FatMonounsaturated fat | +147.5% |
~equal in
Polyunsaturated fat
~4.163g


