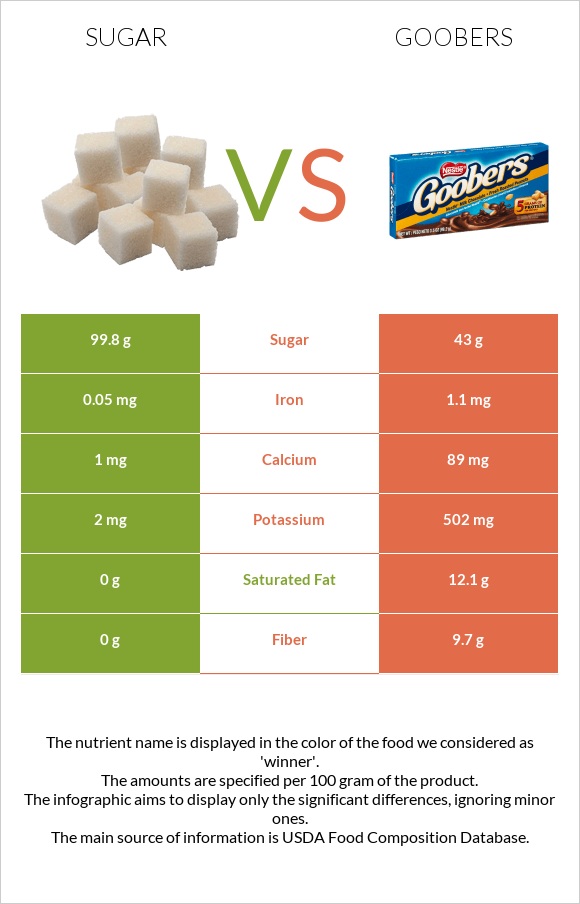
Significant differences between sugar and goobers The amount of fiber, potassium, iron, and calcium in goobers is higher than in sugar. Goobers cover your daily saturated fat needs 61% more than sugar. Goobers have 2 times less sugar than sugar. Sugar has 99.8g of sugar, while goobers have 43g. Specific food types used in this comparison are Sugars, granulated and Candies, NESTLE, GOOBERS Chocolate Covered Peanuts .
Infographic
Mineral Comparison
Mineral comparison score is based on the number of minerals by which one or the other food is richer. The "coverage" charts below show how much of the daily needs can be covered by 300 grams of the food.
5
100 g
300 g
1 serving 1 cube - 2.3g 1 serving packet - 2.8g 1 tsp - 4.2g 1 cup - 200g
Magnesium
Magnesium
Calcium
Calcium
Potassium
Potassium
Iron
Iron
Copper
Copper
Zinc
Zinc
Phosphorus
Phosphorus
Sodium
Sodium
Manganese
Manganese
Selenium
Selenium
0%
0.3%
0.18%
1.9%
2.3%
0.27%
0%
0.13%
0.52%
3.3%
3
100 g
300 g
1 package 1.375 oz - 39g 1 serving 0.25 cup - 41g 1 serving fun size - 48g
Magnesium
Magnesium
Calcium
Calcium
Potassium
Potassium
Iron
Iron
Copper
Copper
Zinc
Zinc
Phosphorus
Phosphorus
Sodium
Sodium
Manganese
Manganese
Selenium
Selenium
0%
27%
44%
41%
0%
0%
0%
4.7%
0%
0%
Vitamin Comparison
Vitamin comparison score is based on the number of vitamins by which one or the other food is richer. The "coverage" charts below show how much of the daily needs can be covered by 300 grams of the food.
1
100 g
300 g
1 serving 1 cube - 2.3g 1 serving packet - 2.8g 1 tsp - 4.2g 1 cup - 200g
Vitamin C
Vit. C
Vitamin D
Vit. D
Vitamin A
Vit. A
Vitamin E
Vit. E
Vitamin B1
Vit. B1
Vitamin B2
Vit. B2
Vitamin B3
Vit. B3
Vitamin B5
Vit. B5
Vitamin B6
Vit. B6
Vitamin B12
Vit. B12
Vitamin K
Vit. K
Folate
Folate
0%
0%
0%
0%
0%
4.4%
0%
0%
0%
0%
0%
0%
1
100 g
300 g
1 package 1.375 oz - 39g 1 serving 0.25 cup - 41g 1 serving fun size - 48g
Vitamin C
Vit. C
Vitamin D
Vit. D
Vitamin A
Vit. A
Vitamin E
Vit. E
Vitamin B1
Vit. B1
Vitamin B2
Vit. B2
Vitamin B3
Vit. B3
Vitamin B5
Vit. B5
Vitamin B6
Vit. B6
Vitamin B12
Vit. B12
Vitamin K
Vit. K
Folate
Folate
1%
0%
0%
0%
0%
0%
0%
0%
0%
0%
0%
0%
All nutrients comparison - raw data values
Nutrient
DV% diff.
Saturated fat
0g
12.1g
55%
Fats
0g
34g
52%
Fiber
0g
9.7g
39%
Protein
0g
9.7g
19%
Carbs
99.98g
53g
16%
Potassium
2mg
502mg
15%
Iron
0.05mg
1.1mg
13%
Calcium
1mg
89mg
9%
Calories
387kcal
512kcal
6%
Cholesterol
0mg
12mg
4%
Sodium
1mg
36mg
2%
Copper
0.007mg
1%
Selenium
0.6µg
1%
Vitamin B2
0.019mg
1%
Protein per 100 calories
0g
1.9g
N/A
Calories per 10 g protein
528kcal
N/A
Weight per 100 calories
26g
20g
N/A
Vitamin C
0mg
0.3mg
0%
Net carbs
99.98g
43.3g
N/A
Sugar
99.8g
43g
N/A
Zinc
0.01mg
0%
Manganese
0.004mg
0%
Trans fat
0.07g
N/A
Macronutrient Comparison
Macronutrient breakdown side-by-side comparison
1
100%
Protein:
0 g
Fats:
0 g
Carbs:
99.98 g
Water:
0.02 g
Other:
0 g
4
10%
34%
53%
2%
Protein:
9.7 g
Fats:
34 g
Carbs:
53 g
Water:
1.9 g
Other:
1.4 g
Contains
more
Carbs Carbs
+88.6%
Contains
more
Protein Protein
+∞%
Contains
more
Fats Fats
+∞%
Contains
more
Water Water
+9400%
Contains
more
Other Other
+∞%