Sunflower oil vs. Sardines — In-Depth Nutrition Comparison
Compare
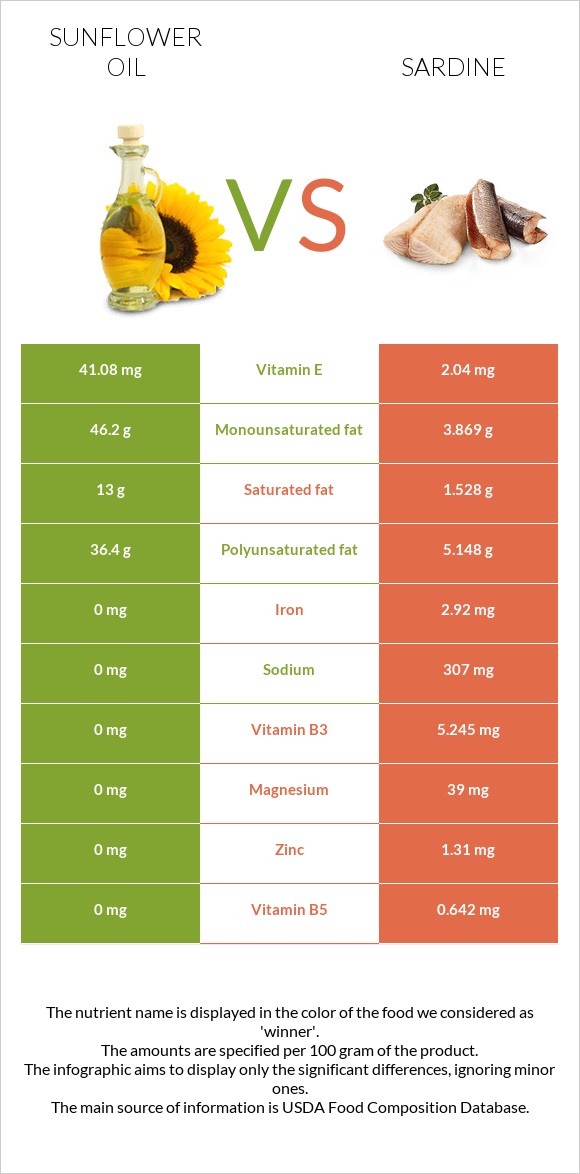
Summary of differences between sunflower oil and sardines
- Sunflower oil has more vitamin E; however, sardines are higher in vitamin B12, selenium, phosphorus, calcium, iron, vitamin B3, and copper.
- Sardines cover your daily need for vitamin B12, 373% more than sunflower oil.
- Sunflower oil has 20 times more vitamin E than sardines. While sunflower oil has 41.08mg of vitamin E, sardines have only 2.04mg.
- Sardines have less saturated fat.
These are the specific foods used in this comparison Oil, sunflower, linoleic, (partially hydrogenated) and Fish, sardine, Atlantic, canned in oil, drained solids with bone.
Infographic
Infographic link
Mineral Comparison
Mineral comparison score is based on the number of minerals by which one or the other food is richer. The "coverage" charts below show how much of the daily needs can be covered by 300 grams of the food.
| Contains less SodiumSodium | -100% |
| Contains more MagnesiumMagnesium | +∞% |
| Contains more CalciumCalcium | +∞% |
| Contains more PotassiumPotassium | +∞% |
| Contains more IronIron | +∞% |
| Contains more CopperCopper | +∞% |
| Contains more ZincZinc | +∞% |
| Contains more PhosphorusPhosphorus | +∞% |
| Contains more ManganeseManganese | +∞% |
| Contains more SeleniumSelenium | +∞% |
Vitamin Comparison
Vitamin comparison score is based on the number of vitamins by which one or the other food is richer. The "coverage" charts below show how much of the daily needs can be covered by 300 grams of the food.
| Contains more Vitamin EVitamin E | +1913.7% |
| Contains more Vitamin KVitamin K | +107.7% |
| Contains more Vitamin AVitamin A | +∞% |
| Contains more Vitamin B1Vitamin B1 | +∞% |
| Contains more Vitamin B2Vitamin B2 | +∞% |
| Contains more Vitamin B3Vitamin B3 | +∞% |
| Contains more Vitamin B5Vitamin B5 | +∞% |
| Contains more Vitamin B6Vitamin B6 | +∞% |
| Contains more Vitamin B12Vitamin B12 | +∞% |
| Contains more FolateFolate | +∞% |
All nutrients comparison - raw data values
| Nutrient |  |
 |
DV% diff. |
| Vitamin B12 | 0µg | 8.94µg | 373% |
| Vitamin E | 41.08mg | 2.04mg | 260% |
| Polyunsaturated fat | 36.4g | 5.148g | 208% |
| Fats | 100g | 11.45g | 136% |
| Monounsaturated fat | 46.2g | 3.869g | 106% |
| Selenium | 0µg | 52.7µg | 96% |
| Phosphorus | 0mg | 490mg | 70% |
| Saturated fat | 13g | 1.528g | 52% |
| Protein | 0g | 24.62g | 49% |
| Cholesterol | 0mg | 142mg | 47% |
| Calcium | 0mg | 382mg | 38% |
| Iron | 0mg | 2.92mg | 37% |
| Calories | 884kcal | 208kcal | 34% |
| Vitamin B3 | 0mg | 5.245mg | 33% |
| Vitamin D | 193 IU | 24% | |
| Vitamin D | 4.8µg | 24% | |
| Copper | 0mg | 0.186mg | 21% |
| Vitamin B2 | 0mg | 0.227mg | 17% |
| Choline | 75mg | 14% | |
| Sodium | 0mg | 307mg | 13% |
| Vitamin B5 | 0mg | 0.642mg | 13% |
| Vitamin B6 | 0mg | 0.167mg | 13% |
| Potassium | 0mg | 397mg | 12% |
| Zinc | 0mg | 1.31mg | 12% |
| Magnesium | 0mg | 39mg | 9% |
| Vitamin B1 | 0mg | 0.08mg | 7% |
| Manganese | 0mg | 0.108mg | 5% |
| Vitamin A | 0µg | 32µg | 4% |
| Folate | 0µg | 10µg | 3% |
| Vitamin K | 5.4µg | 2.6µg | 2% |
| Tryptophan | 0mg | 0.276mg | 0% |
| Threonine | 0mg | 1.079mg | 0% |
| Isoleucine | 0mg | 1.134mg | 0% |
| Leucine | 0mg | 2.001mg | 0% |
| Lysine | 0mg | 2.26mg | 0% |
| Methionine | 0mg | 0.729mg | 0% |
| Phenylalanine | 0mg | 0.961mg | 0% |
| Valine | 0mg | 1.268mg | 0% |
| Histidine | 0mg | 0.725mg | 0% |
| Omega-3 - EPA | 0g | 0.473g | N/A |
| Omega-3 - DHA | 0g | 0.509g | N/A |
Macronutrient Comparison
Macronutrient breakdown side-by-side comparison
Protein:
0 g
Fats:
100 g
Carbs:
0 g
Water:
0 g
Other:
0 g
Protein:
24.62 g
Fats:
11.45 g
Carbs:
0 g
Water:
59.61 g
Other:
4.32 g
| Contains more FatsFats | +773.4% |
| Contains more ProteinProtein | +∞% |
| Contains more WaterWater | +∞% |
| Contains more OtherOther | +∞% |
~equal in
Carbs
~0g
Fat Type Comparison
Fat type breakdown side-by-side comparison
Saturated fat:
Sat. Fat
13 g
Monounsaturated fat:
Mono. Fat
46.2 g
Polyunsaturated fat:
Poly. Fat
36.4 g
Saturated fat:
Sat. Fat
1.528 g
Monounsaturated fat:
Mono. Fat
3.869 g
Polyunsaturated fat:
Poly. Fat
5.148 g
| Contains more Mono. FatMonounsaturated fat | +1094.1% |
| Contains more Poly. FatPolyunsaturated fat | +607.1% |
| Contains less Sat. FatSaturated fat | -88.2% |


