Sunflower seeds vs. Brazil nut — In-Depth Nutrition Comparison
Compare
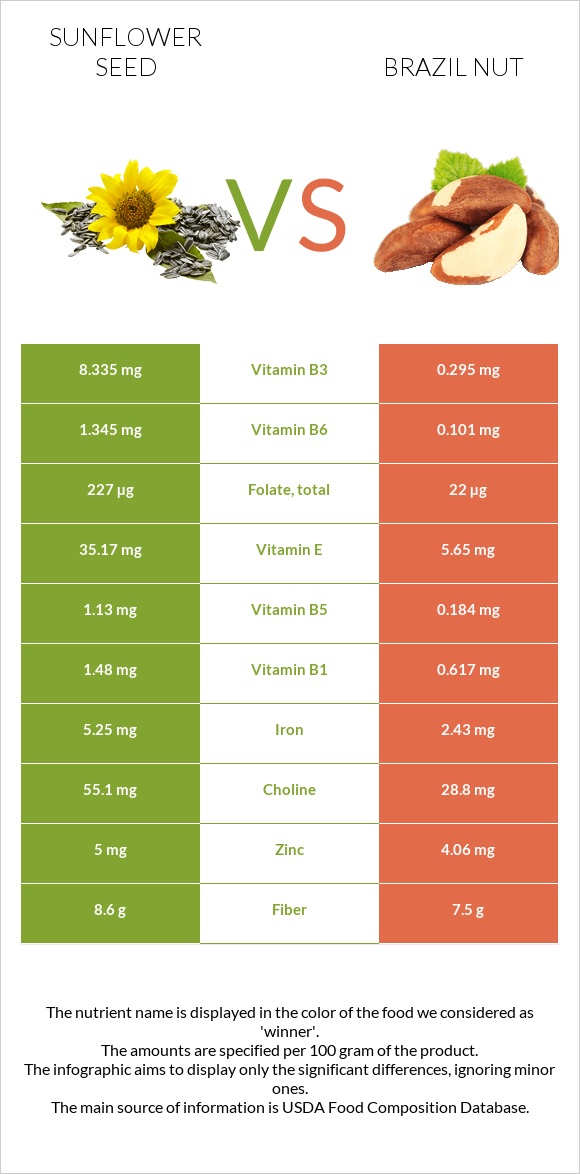
The main differences between sunflower seeds and brazil nut
- Sunflower seeds are richer in vitamin E, vitamin B6, vitamin B1, folate, vitamin B3, iron, manganese, and vitamin B2, yet brazil nut is richer in selenium.
- Daily need coverage for selenium for brazil nut is 3389% higher.
- Sunflower seeds contain 28 times more vitamin B3 than brazil nut. Sunflower seeds contain 8.335mg of vitamin B3, while brazil nut contains 0.295mg.
- Sunflower seeds contain less saturated fat.
Food types used in this article are Seeds, sunflower seed kernels, dried and Nuts, brazilnuts, dried, unblanched.
Infographic
Infographic link
Mineral Comparison
Mineral comparison score is based on the number of minerals by which one or the other food is richer. The "coverage" charts below show how much of the daily needs can be covered by 300 grams of the food.
| Contains more IronIron | +116% |
| Contains more ZincZinc | +23.2% |
| Contains more ManganeseManganese | +59.4% |
| Contains more MagnesiumMagnesium | +15.7% |
| Contains more CalciumCalcium | +105.1% |
| Contains less SodiumSodium | -66.7% |
| Contains more SeleniumSelenium | +3517% |
Vitamin Comparison
Vitamin comparison score is based on the number of vitamins by which one or the other food is richer. The "coverage" charts below show how much of the daily needs can be covered by 300 grams of the food.
| Contains more Vitamin CVitamin C | +100% |
| Contains more Vitamin AVitamin A | +∞% |
| Contains more Vitamin EVitamin E | +522.5% |
| Contains more Vitamin B1Vitamin B1 | +139.9% |
| Contains more Vitamin B2Vitamin B2 | +914.3% |
| Contains more Vitamin B3Vitamin B3 | +2725.4% |
| Contains more Vitamin B5Vitamin B5 | +514.1% |
| Contains more Vitamin B6Vitamin B6 | +1231.7% |
| Contains more FolateFolate | +931.8% |
All nutrients comparison - raw data values
| Nutrient |  |
 |
DV% diff. |
| Selenium | 53µg | 1917µg | 3389% |
| Vitamin E | 35.17mg | 5.65mg | 197% |
| Vitamin B6 | 1.345mg | 0.101mg | 96% |
| Vitamin B1 | 1.48mg | 0.617mg | 72% |
| Saturated fat | 4.455g | 16.134g | 53% |
| Folate | 227µg | 22µg | 51% |
| Vitamin B3 | 8.335mg | 0.295mg | 50% |
| Iron | 5.25mg | 2.43mg | 35% |
| Manganese | 1.95mg | 1.223mg | 32% |
| Vitamin B2 | 0.355mg | 0.035mg | 25% |
| Fats | 51.46g | 67.1g | 24% |
| Vitamin B5 | 1.13mg | 0.184mg | 19% |
| Protein | 20.78g | 14.32g | 13% |
| Monounsaturated fat | 18.528g | 23.879g | 13% |
| Magnesium | 325mg | 376mg | 12% |
| Zinc | 5mg | 4.06mg | 9% |
| Phosphorus | 660mg | 725mg | 9% |
| Calcium | 78mg | 160mg | 8% |
| Polyunsaturated fat | 23.137g | 24.399g | 8% |
| Copper | 1.8mg | 1.743mg | 6% |
| Choline | 55.1mg | 28.8mg | 5% |
| Calories | 584kcal | 659kcal | 4% |
| Fiber | 8.6g | 7.5g | 4% |
| Carbs | 20g | 11.74g | 3% |
| Vitamin C | 1.4mg | 0.7mg | 1% |
| Protein per 100 calories | 3.6g | 2.2g | N/A |
| Calories per 10 g protein | 281kcal | 460kcal | N/A |
| Weight per 100 calories | 17g | 15g | N/A |
| Unsaturated / Saturated Fat ratio | 9.4 | 3 | N/A |
| Net carbs | 11.4g | 4.24g | N/A |
| Potassium | 645mg | 659mg | 0% |
| Sugar | 2.62g | 2.33g | N/A |
| Starch | 0.25g | 0% | |
| Sodium | 9mg | 3mg | 0% |
| Vitamin A | 3µg | 0µg | 0% |
| Tryptophan | 0.348mg | 0.135mg | 0% |
| Threonine | 0.928mg | 0.365mg | 0% |
| Isoleucine | 1.139mg | 0.518mg | 0% |
| Leucine | 1.659mg | 1.19mg | 0% |
| Lysine | 0.937mg | 0.49mg | 0% |
| Methionine | 0.494mg | 1.124mg | 0% |
| Phenylalanine | 1.169mg | 0.639mg | 0% |
| Valine | 1.315mg | 0.76mg | 0% |
| Histidine | 0.632mg | 0.409mg | 0% |
| Omega-3 - EPA | 0.014g | 0g | N/A |
| Omega-3 - ALA | 0.018g | N/A | |
| Omega-6 - Gamma-linoleic acid | 0.018g | N/A | |
| Omega-6 - Linoleic acid | 23.859g | N/A |
Macronutrient Comparison
Macronutrient breakdown side-by-side comparison
Protein:
20.78 g
Fats:
51.46 g
Carbs:
20 g
Water:
4.73 g
Other:
3.03 g
Protein:
14.32 g
Fats:
67.1 g
Carbs:
11.74 g
Water:
3.42 g
Other:
3.42 g
| Contains more ProteinProtein | +45.1% |
| Contains more CarbsCarbs | +70.4% |
| Contains more WaterWater | +38.3% |
| Contains more FatsFats | +30.4% |
| Contains more OtherOther | +12.9% |
Fat Type Comparison
Fat type breakdown side-by-side comparison
Saturated fat:
Sat. Fat
4.455 g
Monounsaturated fat:
Mono. Fat
18.528 g
Polyunsaturated fat:
Poly. Fat
23.137 g
Saturated fat:
Sat. Fat
16.134 g
Monounsaturated fat:
Mono. Fat
23.879 g
Polyunsaturated fat:
Poly. Fat
24.399 g
| Contains less Sat. FatSaturated fat | -72.4% |
| Contains more Mono. FatMonounsaturated fat | +28.9% |
~equal in
Polyunsaturated fat
~24.399g
Carbohydrate type comparison
Carbohydrate type breakdown side-by-side comparison
Starch:
0 g
Sucrose:
2.5 g
Glucose:
0 g
Fructose:
0 g
Lactose:
0 g
Maltose:
0 g
Galactose:
0 g
Starch:
0.25 g
Sucrose:
2.33 g
Glucose:
0 g
Fructose:
0 g
Lactose:
0 g
Maltose:
0 g
Galactose:
0 g
| Contains more StarchStarch | +∞% |
~equal in
Sucrose
~2.33g
~equal in
Glucose
~0g
~equal in
Fructose
~0g
~equal in
Lactose
~0g
~equal in
Maltose
~0g
~equal in
Galactose
~0g


