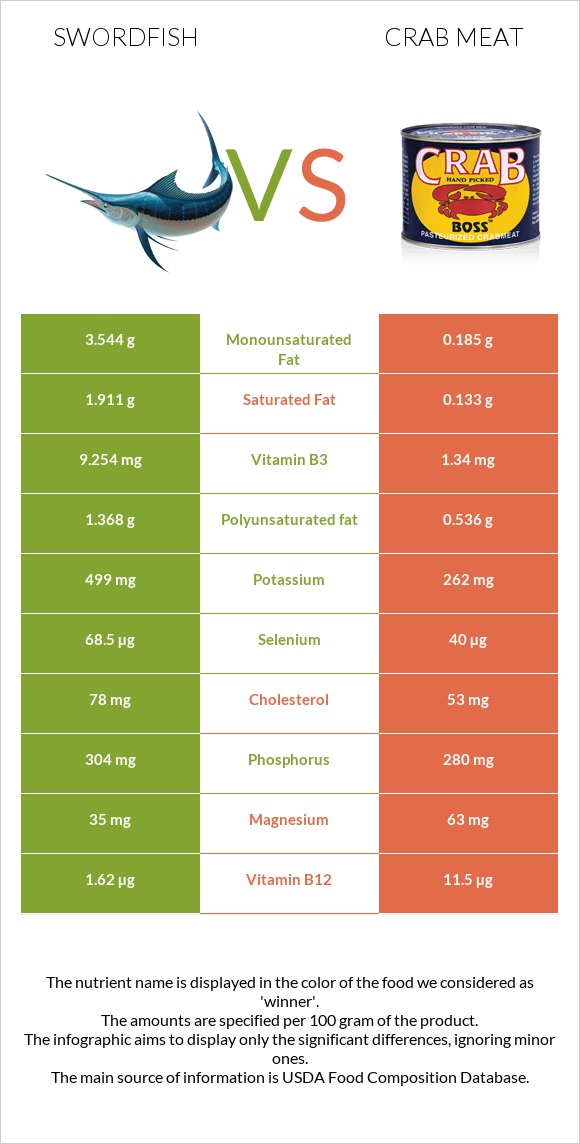
How are swordfish and crab meat different? Swordfish is richer in selenium, vitamin B3, and vitamin B6, while crab meat is higher in vitamin B12, copper, zinc, folate, and vitamin C. Crab meat covers your daily need for vitamin B12, 412% more than swordfish. Swordfish contains 14 times more saturated fat than crab meat. Swordfish contains 1.911g of saturated fat, while crab meat contains 0.133g. Fish, swordfish, cooked, dry heat and Crustaceans, crab, alaska king, cooked, moist heat types were used in this article.
Infographic
Mineral Comparison
Mineral comparison score is based on the number of minerals by which one or the other food is richer. The "coverage" charts below show how much of the daily needs can be covered by 300 grams of the food.
3
100 g
300 g
3 oz - 85g 1 piece - 106g
Magnesium
Magnesium
Calcium
Calcium
Potassium
Potassium
Iron
Iron
Copper
Copper
Zinc
Zinc
Phosphorus
Phosphorus
Sodium
Sodium
Manganese
Manganese
Selenium
Selenium
25%
1.8%
44%
17%
15%
21%
130%
13%
1.7%
374%
6
100 g
300 g
3 oz - 85g 1 leg - 134g
Magnesium
Magnesium
Calcium
Calcium
Potassium
Potassium
Iron
Iron
Copper
Copper
Zinc
Zinc
Phosphorus
Phosphorus
Sodium
Sodium
Manganese
Manganese
Selenium
Selenium
45%
18%
23%
29%
394%
208%
120%
140%
5.2%
218%
Vitamin Comparison
Vitamin comparison score is based on the number of vitamins by which one or the other food is richer. The "coverage" charts below show how much of the daily needs can be covered by 300 grams of the food.
8
100 g
300 g
3 oz - 85g 1 piece - 106g
Vitamin C
Vit. C
Vitamin D
Vit. D
Vitamin A
Vit. A
Vitamin E
Vit. E
Vitamin B1
Vit. B1
Vitamin B2
Vit. B2
Vitamin B3
Vit. B3
Vitamin B5
Vit. B5
Vitamin B6
Vit. B6
Vitamin B12
Vit. B12
Vitamin K
Vit. K
Folate
Folate
0%
249%
14%
48%
22%
15%
174%
25%
142%
203%
0.25%
1.5%
3
100 g
300 g
3 oz - 85g 1 leg - 134g
Vitamin C
Vit. C
Vitamin D
Vit. D
Vitamin A
Vit. A
Vitamin E
Vit. E
Vitamin B1
Vit. B1
Vitamin B2
Vit. B2
Vitamin B3
Vit. B3
Vitamin B5
Vit. B5
Vitamin B6
Vit. B6
Vitamin B12
Vit. B12
Vitamin K
Vit. K
Folate
Folate
25%
0%
3%
0%
13%
13%
25%
24%
42%
1438%
0%
38%
All nutrients comparison - raw data values
Nutrient
DV% diff.
Vitamin B12
1.62µg
11.5µg
412%
Copper
0.046mg
1.182mg
126%
Vitamin D*
666 IU
83%
Vitamin D
16.6µg
83%
Zinc
0.78mg
7.62mg
62%
Selenium
68.5µg
40µg
52%
Vitamin B3
9.254mg
1.34mg
49%
Sodium
97mg
1072mg
42%
Vitamin B6
0.615mg
0.18mg
33%
Vitamin E
2.41mg
16%
Choline
77.5mg
14%
Folate
2µg
51µg
12%
Fats
7.93g
1.54g
10%
Protein
23.45g
19.35g
8%
Vitamin C
0mg
7.6mg
8%
Cholesterol
78mg
53mg
8%
Saturated fat
1.911g
0.133g
8%
Monounsaturated fat
3.544g
0.185g
8%
Magnesium
35mg
63mg
7%
Potassium
499mg
262mg
7%
Polyunsaturated fat
1.368g
0.536g
6%
Calcium
6mg
59mg
5%
Calories
172kcal
97kcal
4%
Iron
0.45mg
0.76mg
4%
Vitamin A
43µg
9µg
4%
Phosphorus
304mg
280mg
3%
Vitamin B1
0.089mg
0.053mg
3%
Manganese
0.013mg
0.04mg
1%
Vitamin B2
0.063mg
0.055mg
1%
Protein per 100 calories
14g
20g
N/A
Calories per 10 g protein
73kcal
50kcal
N/A
Weight per 100 calories
58g
103g
N/A
Unsaturated / Saturated Fat ratio
2.6
5.4
N/A
Vitamin B5
0.417mg
0.4mg
0%
Vitamin K
0.1µg
0%
Trans fat
0.056g
N/A
Tryptophan
0.265mg
0.269mg
0%
Threonine
1.035mg
0.783mg
0%
Isoleucine
1.088mg
0.938mg
0%
Leucine
1.919mg
1.536mg
0%
Lysine
2.168mg
1.684mg
0%
Methionine
0.699mg
0.545mg
0%
Phenylalanine
0.922mg
0.817mg
0%
Valine
1.216mg
0.91mg
0%
Histidine
0.695mg
0.393mg
0%
Omega-3 - EPA
0.127g
0.295g
N/A
Omega-3 - DHA
0.772g
0.118g
N/A
Omega-3 - DPA
0.168g
0.031g
N/A
Omega-6 - Eicosadienoic acid
0.022g
N/A
Macronutrient Comparison
Macronutrient breakdown side-by-side comparison
2
23%
8%
68%
Protein:
23.45 g
Fats:
7.93 g
Carbs:
0 g
Water:
68.26 g
Other:
0.36 g
2
19%
78%
Protein:
19.35 g
Fats:
1.54 g
Carbs:
0 g
Water:
77.55 g
Other:
1.56 g
Contains
more
Protein Protein
+21.2%
Contains
more
Fats Fats
+414.9%
Contains
more
Water Water
+13.6%
Contains
more
Other Other
+333.3%
Fat Type Comparison
Fat type breakdown side-by-side comparison
2
28%
52%
20%
Saturated fat:
Sat. Fat
1.911 g
Monounsaturated fat:
Mono. Fat
3.544 g
Polyunsaturated fat:
Poly. Fat
1.368 g
1
16%
22%
63%
Saturated fat:
Sat. Fat
0.133 g
Monounsaturated fat:
Mono. Fat
0.185 g
Polyunsaturated fat:
Poly. Fat
0.536 g
Contains
more
Mono. Fat Monounsaturated fat
+1815.7%
Contains
more
Poly. Fat Polyunsaturated fat
+155.2%
Contains
less
Sat. Fat Saturated fat
-93%