Burrito vs. Taco - Nutrition Comparison and Health Impact


Summary
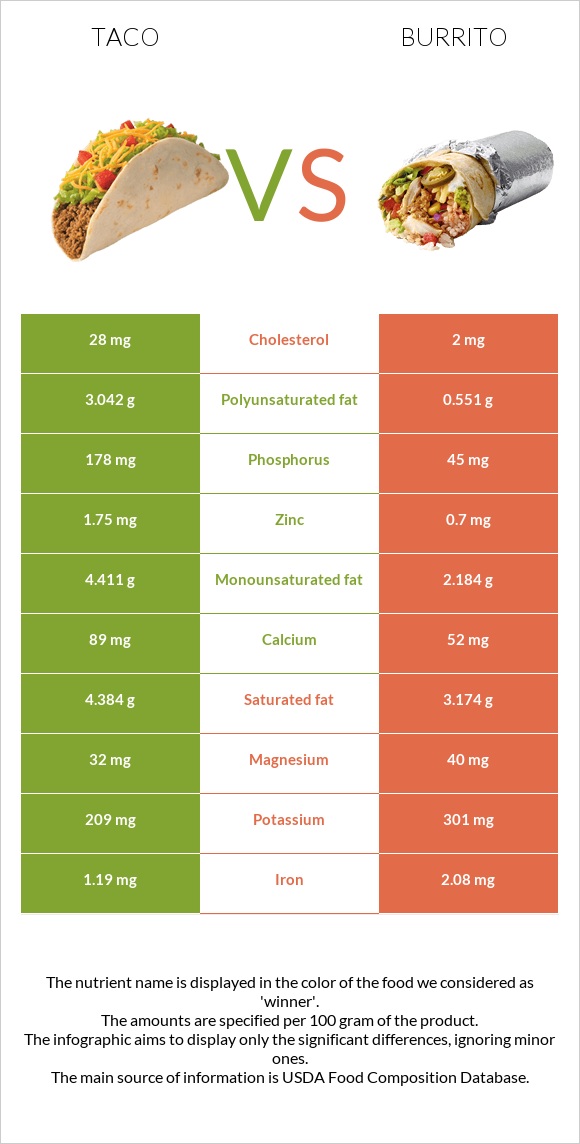
Taco has more phosphorus, calcium, Vitamin B12, and zinc. It is also lower in sodium than burritos. On the other hand, a burrito provides more Vitamin B1, Vitamin B2, Vitamin A, iron, copper, manganese, and potassium. Burrito is also lower in saturated fats, sugars, and cholesterol.
Introduction
Do you know what the word “taco” means? The real meaning of it is a "light snack" in Mexican, which perfectly explains the name. The word "burrito" means "a little donkey" because Mexicans frequently resemble a finished burrito with a donkey's ear.
Burritos and tacos are popular Mexican dishes that are often confused by people outside Mexico. So, how to distinguish between them? We’ll go through their actual differences, focusing on nutrition and discussing some health impacts.
What’s The Actual Difference?
Size
Tacos are smaller in size than burritos. Tacos are well-known light snacks. Burrito is considered a full whole meal. In contrast, you need to eat several tacos to substitute a whole meal for it. Besides, burritos can have double filling compared to a single filling of tacos.
Ingredients
Basically, the most important difference is the taste of these two which depends on the different ingredients they contain. Let's split them into three categories.
Wrap - the taco ingredients are filled in a light corn tortilla that is easy to crack due to its softness. In contrast, burritos are wrapped in a large flour-made wrap that often equals the size of a plate. Burrito tortillas may be flavored with tomatoes or spinach.
Filling - here comes the most significant difference. Tacos are usually filled with only one kind of meat - chicken, pulled pork, beef, fish, or shrimp, plus some light adding - lettuce, tomato, cabbage, etc. In contrast, burrito filling is meat with a variety of extremely healthier mixes: beans, vegetables, rice, and cheese.
Garnishing - burritos are usually served without any garnishing, while tacos may have onions, sour cream, or different sauces as a garnish.
Nutrition
At the bottom of this page, you can find a nutrition table, which will help you better understand the differences in the nutrition of burritos and tacos.
Calories
Overall, burritos and tacos have almost an equal amount of calories. Burritos have 206 calories per 100 g, while tacos have 226 calories per 100 g.
100g servings of these foods are classified as medium-calorie foods. Consider that full burritos or tacos may weigh more than 100g and consequently have more calories.
Fats
Tacos have higher amounts of fats than burritos. It has 12.7g of fats per 100 g, whereas a burrito has 6.22 g per 100 g. Taco contains 4g saturated fats and 4g mono/polyunsaturated fats. Burrito provides 3g saturated and 2g monounsaturated fats.
Cholesterol
Taco contains 14 times higher cholesterol than a burrito. It provides 28mg of cholesterol per 100g, whereas a burrito contains only 2mg of cholesterol.
Fat Type Comparison
Contains
more
Mono. FatMonounsaturated fat
+102%
Contains
more
Poly. FatPolyunsaturated fat
+452.1%
Contains
less
Sat. FatSaturated fat
-27.6%
Carbs
The level of carbs in burritos is higher than in tacos. It contains 32.92 g of carbs, whereas tacos have 19.85g of carbs per 100g. The number of carbs in the burrito comes from ingredients.
Proteins
Taco contains higher amounts of protein than a burrito. It has almost 2.5g more protein. Depending on the type of meat they contain, tacos and burritos may have different types of essential or non-essential amino acids.
Macronutrient Comparison
Contains
more
ProteinProtein
+36.7%
Contains
more
FatsFats
+104.2%
Contains
more
CarbsCarbs
+65.8%
Contains
more
OtherOther
+17.8%
Minerals
The mineral amounts of burritos and tacos are almost equal. Taco contains two times higher phosphorus, calcium, and zinc than a burrito.
The amount of sodium is also lower in tacos.
Contrariwise, a burrito has two times more copper and more iron, magnesium, and potassium than a taco. The levels of magnesium and iron are also higher in the burrito.
Mineral Comparison
Contains
more
CalciumCalcium
+71.2%
Contains
more
ZincZinc
+150%
Contains
more
PhosphorusPhosphorus
+295.6%
Contains
less
SodiumSodium
-12.6%
Contains
more
MagnesiumMagnesium
+25%
Contains
more
PotassiumPotassium
+44%
Contains
more
IronIron
+74.8%
Contains
more
CopperCopper
+126%
Contains
more
ManganeseManganese
+60.6%
Vitamins
Burritos have a higher vitamin content than tacos. Burritos provide four times more Vitamin B1 and three times more Vitamin B2.
The amounts of Vitamin A, Vitamin C, Vitamin B3, Vitamin B6, and folate are also high in burritos.
On the other hand, taco contains more Vitamin B12 and Vitamin D than burritos.
Vitamin Comparison
Contains
more
Vitamin DVitamin D
+∞%
Contains
more
Vitamin AVitamin A
+∞%
Contains
more
Vitamin EVitamin E
+∞%
Contains
more
Vitamin B12Vitamin B12
+86%
Contains
more
Vitamin KVitamin K
+∞%
Contains
more
Vitamin CVitamin C
+125%
Contains
more
Vitamin B1Vitamin B1
+480%
Contains
more
Vitamin B2Vitamin B2
+366.7%
Contains
more
Vitamin B3Vitamin B3
+13.3%
Contains
more
Vitamin B6Vitamin B6
+55.6%
Contains
more
FolateFolate
+110.5%
Glycemic index
The glycemic index of a burrito is equal to 37; a taco has a GI of 39. Both are considered low glycemic index foods.
Acidity
The potential renal acid load (PRAL) of food describes its acidity by indicating the acid production of the food within the body. The acidity of a burrito is about 3.2 (alkaline), while that of a taco is 4.5 (acidic).
Health Impact
Diabetes
One Indian study shows the correlation between burrito consumption and high BMI (body measure size) is present, leading to increased risks of developing diabetes [1]. Besides, research confirms the link between eating red meat and developing type 2 diabetes. Red meat, mainly processed meats, contains a lot of heme iron, which raises blood sugar levels [2].
Cardiovascular health
When comparing a burrito and a taco in terms of cardiovascular health, several factors come into play:
The caloric content and portion size: tacos tend to be larger and can contain more calories compared to burritos. Consuming excessive calories can contribute to weight gain and obesity, which are risk factors for cardiovascular diseases.
Sodium content: Both burritos and tacos definitely have high sodium content, which is directly linked to hypertension (high blood pressure), a major risk factor for heart disease and stroke.
The Dietary Guidelines for Americans suggest that adults limit their sodium intake to less than 2,300 mg per day, which is about 1 teaspoon of table salt. The recommended limits for kids under 14 are even lower [3].
Types of fats: Both dishes can contain fats from cooking oils, cheese, and meats. However, tacos are slightly higher in saturated fat than burritos. High consumption of saturated fats may increase cardiovascular risk (including the risk of myocardial infarction and stroke) [4].
In summary, portion control is crucial when it comes to enjoying tacos and burritos, as it helps prevent overconsumption of calories, fats, and sodium. By consuming them in moderation and incorporating other nutritious foods, you can significantly enhance your overall cardiovascular health.
Red meat allergy
People usually have red meat allergies if sensitive to cat serum albumin, which reacts with pork albumin. Urticaria, vomiting, and stomach cramps are common symptoms, with anaphylaxis occurring in rare cases [5]. These cases are frequently associated with specific IgE to galactose-1,3-galactose (-Gal), an oligosaccharide found in non-primate mammals.
References
- https://journals.plos.org/plosone/article?id=10.1371/journal.pone.0229716
- https://pubmed.ncbi.nlm.nih.gov/27744145/
- https://www.fda.gov/food/nutrition-education-resources-materials/sodium-your-diet
- https://www.escardio.org/The-ESC/Press-Office/Press-releases/Are-all-saturated-fats-equally-bad-for-the-heart
- www.ncbi.nlm.nih.gov/pmc/articles/PMC6488443/

Infographic
All nutrients comparison - raw data values
| Nutrient | |
|
DV% diff. |
| Vitamin B1 | 0.05mg | 0.29mg | 20% |
| Phosphorus | 178mg | 45mg | 19% |
| Vitamin B5 | 0.92mg | 18% | |
| Vitamin B12 | 0.93µg | 0.5µg | 18% |
| Vitamin B2 | 0.06mg | 0.28mg | 17% |
| Polyunsaturated fat | 3.042g | 0.551g | 17% |
| Fiber | 3.9g | 16% | |
| Vitamin K | 15.3µg | 13% | |
| Iron | 1.19mg | 2.08mg | 11% |
| Copper | 0.077mg | 0.174mg | 11% |
| Fats | 12.7g | 6.22g | 10% |
| Zinc | 1.75mg | 0.7mg | 10% |
| Cholesterol | 28mg | 2mg | 9% |
| Manganese | 0.249mg | 0.4mg | 7% |
| Starch | 14.78g | 6% | |
| Saturated fat | 4.384g | 3.174g | 6% |
| Monounsaturated fat | 4.411g | 2.184g | 6% |
| Protein | 8.86g | 6.48g | 5% |
| Folate | 19µg | 40µg | 5% |
| Carbs | 19.85g | 32.92g | 4% |
| Calcium | 89mg | 52mg | 4% |
| Vitamin E | 0.6mg | 4% | |
| Vitamin B6 | 0.09mg | 0.14mg | 4% |
| Potassium | 209mg | 301mg | 3% |
| Magnesium | 32mg | 40mg | 2% |
| Sodium | 397mg | 454mg | 2% |
| Vitamin A | 20µg | 2% | |
| Selenium | 9.2µg | 10.1µg | 2% |
| Calories | 226kcal | 206kcal | 1% |
| Vitamin C | 0.4mg | 0.9mg | 1% |
| Vitamin D* | 4 IU | 1% | |
| Vitamin D | 0.1µg | 1% | |
| Vitamin B3 | 1.65mg | 1.87mg | 1% |
| Choline | 32mg | 26.8mg | 1% |
| Protein per 100 calories | 3.9g | 3.1g | N/A |
| Calories per 10 g protein | 255kcal | 318kcal | N/A |
| Weight per 100 calories | 44g | 49g | N/A |
| Unsaturated / Saturated Fat ratio | 1.7 | 0.86 | N/A |
| Net carbs | 15.95g | 32.92g | N/A |
| Sugar | 0.9g | N/A | |
| Trans fat | 0.467g | N/A | |
| Tryptophan | 0.079mg | 0% | |
| Threonine | 0.244mg | 0% | |
| Isoleucine | 0.27mg | 0% | |
| Leucine | 0.504mg | 0% | |
| Lysine | 0.343mg | 0% | |
| Methionine | 0.107mg | 0% | |
| Phenylalanine | 0.351mg | 0% | |
| Valine | 0.319mg | 0% | |
| Histidine | 0.172mg | 0% | |
| Fructose | 0.3g | 0% | |
| Omega-3 - EPA | 0.005g | N/A | |
| Omega-3 - ALA | 0.166g | N/A | |
| Omega-3 - DPA | 0.006g | N/A | |
| Omega-3 - Eicosatrienoic acid | 0.001g | N/A | |
| Omega-6 - Gamma-linoleic acid | 0.002g | N/A | |
| Omega-6 - Dihomo-gamma-linoleic acid | 0.011g | N/A | |
| Omega-6 - Eicosadienoic acid | 0.004g | N/A | |
| Omega-6 - Linoleic acid | 2.708g | N/A |
People also compare


References
All the values for which the sources are not specified explicitly are taken from FDA’s Food Central. The exact link to the food presented on this page can be found below.
- Taco - https://fdc.nal.usda.gov/fdc-app.html#/food-details/170689/nutrients
- Burrito - https://fdc.nal.usda.gov/fdc-app.html#/food-details/172038/nutrients
All the Daily Values are presented for males aged 31-50, for 2000-calorie diets.