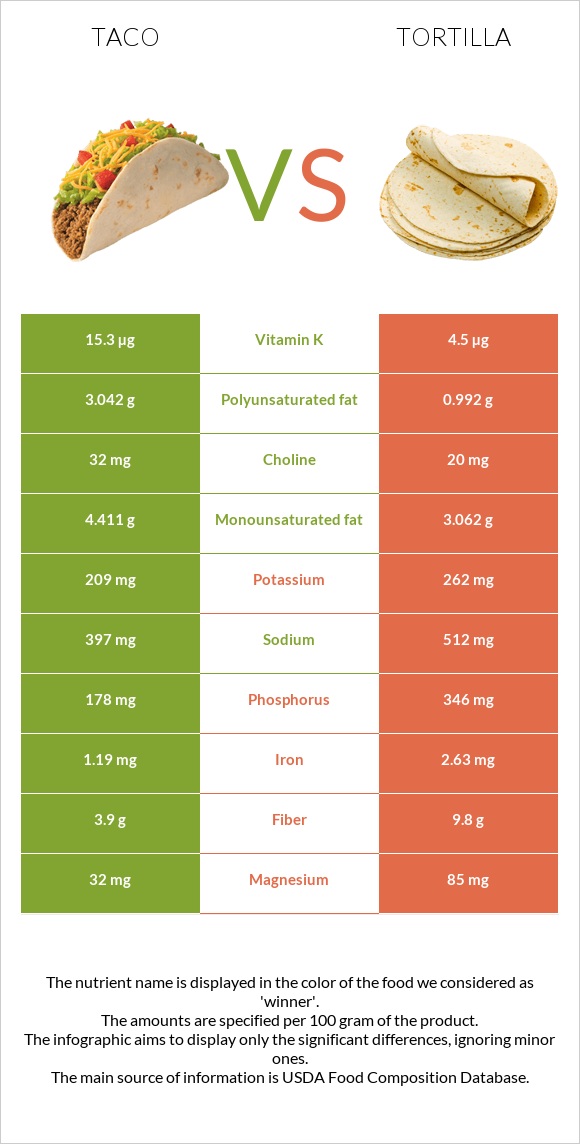
What are the differences between taco and tortillas? Taco is higher in vitamin B12, yet tortillas are higher in vitamin B1, selenium, folate, phosphorus, fiber, copper, vitamin B3, iron, and vitamin B2. Tortillas' daily need coverage for vitamin B1 is 64% more. The glycemic index of taco is lower. We used Fast foods, taco with beef, cheese, and lettuce, hard shell and Tortillas, ready-to-bake or -fry, whole wheat types in this article.
Infographic
Mineral Comparison
Mineral comparison score is based on the number of minerals by which one or the other food is richer. The "coverage" charts below show how much of the daily needs can be covered by 300 grams of the food.
2
100 g
300 g
1 each taco - 69g
Magnesium
Magnesium
Calcium
Calcium
Potassium
Potassium
Iron
Iron
Copper
Copper
Zinc
Zinc
Phosphorus
Phosphorus
Sodium
Sodium
Manganese
Manganese
Selenium
Selenium
23%
27%
18%
45%
26%
48%
76%
52%
32%
50%
7
100 g
300 g
1 tortilla 1 serving - 41g
Magnesium
Magnesium
Calcium
Calcium
Potassium
Potassium
Iron
Iron
Copper
Copper
Zinc
Zinc
Phosphorus
Phosphorus
Sodium
Sodium
Manganese
Manganese
Selenium
Selenium
61%
73%
23%
99%
89%
52%
148%
67%
0%
202%
Vitamin Comparison
Vitamin comparison score is based on the number of vitamins by which one or the other food is richer. The "coverage" charts below show how much of the daily needs can be covered by 300 grams of the food.
5
100 g
300 g
1 each taco - 69g
Vitamin C
Vit. C
Vitamin D
Vit. D
Vitamin A
Vit. A
Vitamin E
Vit. E
Vitamin B1
Vit. B1
Vitamin B2
Vit. B2
Vitamin B3
Vit. B3
Vitamin B5
Vit. B5
Vitamin B6
Vit. B6
Vitamin B12
Vit. B12
Vitamin K
Vit. K
Folate
Folate
1.3%
1.5%
6.7%
12%
13%
14%
31%
0%
21%
116%
38%
14%
6
100 g
300 g
1 tortilla 1 serving - 41g
Vitamin C
Vit. C
Vitamin D
Vit. D
Vitamin A
Vit. A
Vitamin E
Vit. E
Vitamin B1
Vit. B1
Vitamin B2
Vit. B2
Vitamin B3
Vit. B3
Vitamin B5
Vit. B5
Vitamin B6
Vit. B6
Vitamin B12
Vit. B12
Vitamin K
Vit. K
Folate
Folate
0%
0%
0%
18%
206%
67%
91%
0%
72%
0%
11%
104%
All nutrients comparison - raw data values
Nutrient
DV% diff.
Vitamin B1
0.05mg
0.823mg
64%
Selenium
9.2µg
37µg
51%
Vitamin B12
0.93µg
0µg
39%
Folate
19µg
138µg
30%
Fiber
3.9g
9.8g
24%
Phosphorus
178mg
346mg
24%
Copper
0.077mg
0.266mg
21%
Vitamin B3
1.65mg
4.858mg
20%
Iron
1.19mg
2.63mg
18%
Vitamin B2
0.06mg
0.289mg
18%
Vitamin B6
0.09mg
0.312mg
17%
Calcium
89mg
244mg
16%
Polyunsaturated fat
3.042g
0.992g
14%
Magnesium
32mg
85mg
13%
Manganese
0.249mg
11%
Carbs
19.85g
45.89g
9%
Cholesterol
28mg
0mg
9%
Vitamin K
15.3µg
4.5µg
9%
Starch
14.78g
6%
Fats
12.7g
9.76g
5%
Sodium
397mg
512mg
5%
Calories
226kcal
310kcal
4%
Monounsaturated fat
4.411g
3.062g
3%
Protein
8.86g
9.76g
2%
Potassium
209mg
262mg
2%
Zinc
1.75mg
1.92mg
2%
Vitamin A
20µg
0µg
2%
Vitamin E
0.6mg
0.9mg
2%
Choline
32mg
20mg
2%
Saturated fat
4.384g
4.878g
2%
Vitamin D*
4 IU
0 IU
1%
Vitamin D
0.1µg
0µg
1%
Protein per 100 calories
3.9g
3.1g
N/A
Calories per 10 g protein
255kcal
318kcal
N/A
Weight per 100 calories
44g
32g
N/A
Unsaturated / Saturated Fat ratio
1.7
0.83
N/A
Vitamin C
0.4mg
0mg
0%
Net carbs
15.95g
36.09g
N/A
Sugar
0.9g
2.44g
N/A
Trans fat
0.467g
0g
N/A
Tryptophan
0.129mg
0%
Threonine
0.312mg
0%
Isoleucine
0.353mg
0%
Leucine
0.671mg
0%
Lysine
0.37mg
0%
Methionine
0.163mg
0%
Phenylalanine
0.488mg
0%
Valine
0.444mg
0%
Histidine
0.255mg
0%
Fructose
0.3g
0%
Omega-3 - EPA
0.005g
0g
N/A
Omega-3 - ALA
0.166g
N/A
Omega-3 - DPA
0.006g
0g
N/A
Omega-3 - Eicosatrienoic acid
0.001g
N/A
Omega-6 - Gamma-linoleic acid
0.002g
N/A
Omega-6 - Dihomo-gamma-linoleic acid
0.011g
N/A
Omega-6 - Eicosadienoic acid
0.004g
0g
N/A
Omega-6 - Linoleic acid
2.708g
N/A
Macronutrient Comparison
Macronutrient breakdown side-by-side comparison
2
9%
13%
20%
57%
Protein:
8.86 g
Fats:
12.7 g
Carbs:
19.85 g
Water:
57.02 g
Other:
1.57 g
3
10%
10%
46%
30%
4%
Protein:
9.76 g
Fats:
9.76 g
Carbs:
45.89 g
Water:
30.15 g
Other:
4.44 g
Contains
more
Fats Fats
+30.1%
Contains
more
Water Water
+89.1%
Contains
more
Protein Protein
+10.2%
Contains
more
Carbs Carbs
+131.2%
Contains
more
Other Other
+182.8%
Fat Type Comparison
Fat type breakdown side-by-side comparison
3
37%
37%
26%
Saturated fat:
Sat. Fat
4.384 g
Monounsaturated fat:
Mono. Fat
4.411 g
Polyunsaturated fat:
Poly. Fat
3.042 g
0
55%
34%
11%
Saturated fat:
Sat. Fat
4.878 g
Monounsaturated fat:
Mono. Fat
3.062 g
Polyunsaturated fat:
Poly. Fat
0.992 g
Contains
less
Sat. Fat Saturated fat
-10.1%
Contains
more
Mono. Fat Monounsaturated fat
+44.1%
Contains
more
Poly. Fat Polyunsaturated fat
+206.7%