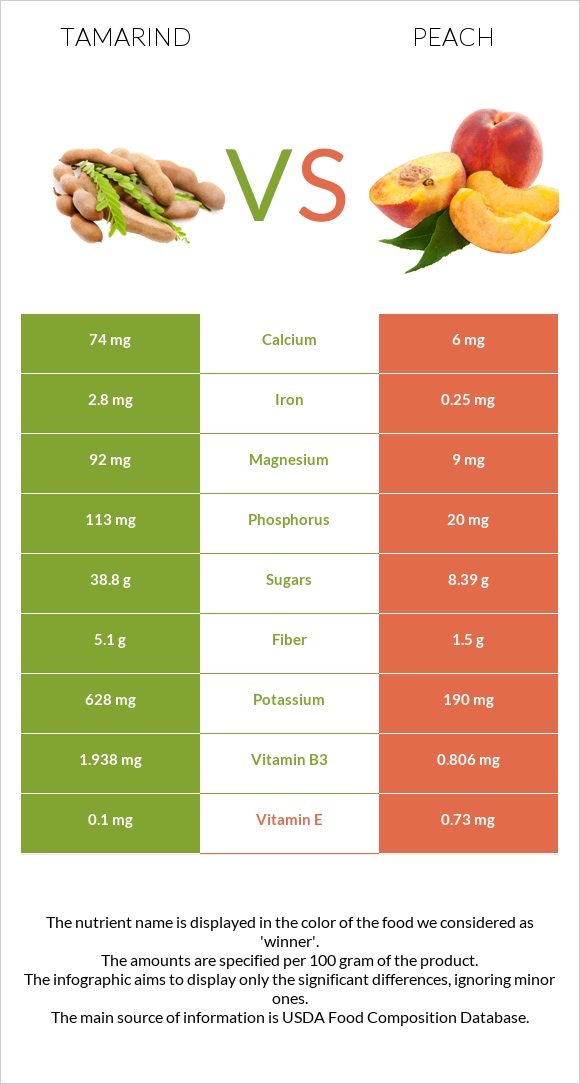
How are tamarind and peach different? Tamarind is richer in vitamin B1, iron, magnesium, fiber, phosphorus, potassium, vitamin B2, vitamin B3, and calcium, while peach is higher in vitamin A. Tamarind covers your daily need for vitamin B1, 34% more than peach. Tamarind contains 12 times more calcium than peach. Tamarind contains 74mg of calcium, while peach contains 6mg. Peach has a higher glycemic index (42) than tamarind (23). Tamarinds, raw and Peaches, yellow, raw types were used in this article.
Infographic
Mineral Comparison
Mineral comparison score is based on the number of minerals by which one or the other food is richer. The "coverage" charts below show how much of the daily needs can be covered by 300 grams of the food.
7
100 g
300 g
1 fruit (3" x 1") - 2g 1 cup, pulp - 120g
Magnesium
Magnesium
Calcium
Calcium
Potassium
Potassium
Iron
Iron
Copper
Copper
Zinc
Zinc
Phosphorus
Phosphorus
Sodium
Sodium
Manganese
Manganese
Selenium
Selenium
66%
22%
55%
105%
29%
2.7%
48%
3.7%
0%
7.1%
3
100 g
300 g
1 small (2-1/2" dia) - 130g 1 NLEA serving - 147g 1 medium (2-2/3" dia) - 150g 1 cup slices - 154g 1 large (2-3/4" dia) - 175g 1 extra large (3" dia) - 224g
Magnesium
Magnesium
Calcium
Calcium
Potassium
Potassium
Iron
Iron
Copper
Copper
Zinc
Zinc
Phosphorus
Phosphorus
Sodium
Sodium
Manganese
Manganese
Selenium
Selenium
6.4%
1.8%
17%
9.4%
23%
4.6%
8.6%
0%
8%
0.55%
Vitamin Comparison
Vitamin comparison score is based on the number of vitamins by which one or the other food is richer. The "coverage" charts below show how much of the daily needs can be covered by 300 grams of the food.
5
100 g
300 g
1 fruit (3" x 1") - 2g 1 cup, pulp - 120g
Vitamin C
Vit. C
Vitamin D
Vit. D
Vitamin A
Vit. A
Vitamin E
Vit. E
Vitamin B1
Vit. B1
Vitamin B2
Vit. B2
Vitamin B3
Vit. B3
Vitamin B5
Vit. B5
Vitamin B6
Vit. B6
Vitamin B12
Vit. B12
Vitamin K
Vit. K
Folate
Folate
12%
0%
0.67%
2%
107%
35%
36%
8.6%
15%
0%
7%
11%
3
100 g
300 g
1 small (2-1/2" dia) - 130g 1 NLEA serving - 147g 1 medium (2-2/3" dia) - 150g 1 cup slices - 154g 1 large (2-3/4" dia) - 175g 1 extra large (3" dia) - 224g
Vitamin C
Vit. C
Vitamin D
Vit. D
Vitamin A
Vit. A
Vitamin E
Vit. E
Vitamin B1
Vit. B1
Vitamin B2
Vit. B2
Vitamin B3
Vit. B3
Vitamin B5
Vit. B5
Vitamin B6
Vit. B6
Vitamin B12
Vit. B12
Vitamin K
Vit. K
Folate
Folate
22%
0%
5.3%
15%
6%
7.2%
15%
9.2%
5.8%
0%
6.5%
3%
All nutrients comparison - raw data values
Nutrient
DV% diff.
Vitamin B1
0.428mg
0.024mg
34%
Iron
2.8mg
0.25mg
32%
Magnesium
92mg
9mg
20%
Carbs
62.5g
9.54g
18%
Fiber
5.1g
1.5g
14%
Potassium
628mg
190mg
13%
Phosphorus
113mg
20mg
13%
Calories
239kcal
39kcal
10%
Vitamin B2
0.152mg
0.031mg
9%
Calcium
74mg
6mg
7%
Vitamin B3
1.938mg
0.806mg
7%
Protein
2.8g
0.91g
4%
Vitamin E
0.1mg
0.73mg
4%
Vitamin C
3.5mg
6.6mg
3%
Manganese
0.061mg
3%
Vitamin B6
0.066mg
0.025mg
3%
Folate
14µg
4µg
3%
Copper
0.086mg
0.068mg
2%
Vitamin A
2µg
16µg
2%
Selenium
1.3µg
0.1µg
2%
Fructose
1.53g
2%
Fats
0.6g
0.25g
1%
Zinc
0.1mg
0.17mg
1%
Sodium
28mg
0mg
1%
Saturated fat
0.272g
0.019g
1%
Protein per 100 calories
1.2g
2.3g
N/A
Calories per 10 g protein
854kcal
429kcal
N/A
Weight per 100 calories
42g
256g
N/A
Net carbs
57.4g
8.04g
N/A
Sugar
38.8g
8.39g
N/A
Vitamin B5
0.143mg
0.153mg
0%
Vitamin K
2.8µg
2.6µg
0%
Choline
8.6mg
6.1mg
0%
Monounsaturated fat
0.181g
0.067g
0%
Polyunsaturated fat
0.059g
0.086g
0%
Tryptophan
0.018mg
0.01mg
0%
Threonine
0.016mg
0%
Isoleucine
0.017mg
0%
Leucine
0.027mg
0%
Lysine
0.139mg
0.03mg
0%
Methionine
0.014mg
0.01mg
0%
Phenylalanine
0.019mg
0%
Valine
0.022mg
0%
Histidine
0.013mg
0%
Macronutrient Comparison
Macronutrient breakdown side-by-side comparison
4
3%
63%
31%
3%
Protein:
2.8 g
Fats:
0.6 g
Carbs:
62.5 g
Water:
31.4 g
Other:
2.7 g
1
10%
89%
Protein:
0.91 g
Fats:
0.25 g
Carbs:
9.54 g
Water:
88.87 g
Other:
0.43 g
Contains
more
Protein Protein
+207.7%
Contains
more
Fats Fats
+140%
Contains
more
Carbs Carbs
+555.1%
Contains
more
Other Other
+527.9%
Contains
more
Water Water
+183%
Fat Type Comparison
Fat type breakdown side-by-side comparison
1
53%
35%
12%
Saturated fat:
Sat. Fat
0.272 g
Monounsaturated fat:
Mono. Fat
0.181 g
Polyunsaturated fat:
Poly. Fat
0.059 g
2
11%
39%
50%
Saturated fat:
Sat. Fat
0.019 g
Monounsaturated fat:
Mono. Fat
0.067 g
Polyunsaturated fat:
Poly. Fat
0.086 g
Contains
more
Mono. Fat Monounsaturated fat
+170.1%
Contains
less
Sat. Fat Saturated fat
-93%
Contains
more
Poly. Fat Polyunsaturated fat
+45.8%