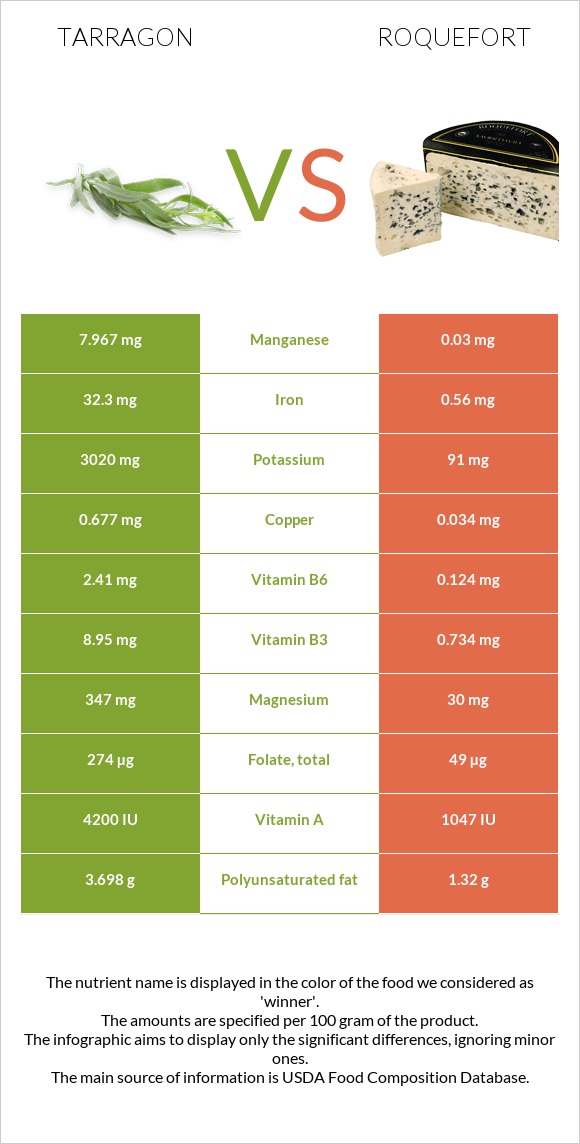
Significant differences between tarragon and roquefort The amount of iron, manganese, vitamin B6, potassium, magnesium, copper, vitamin A, and vitamin B2 in tarragon is higher than in roquefort. Tarragon covers your daily iron needs 397% more than roquefort. Roquefort has 266 times less manganese than tarragon. Tarragon has 7.967mg of manganese, while roquefort has 0.03mg. Tarragon contains less saturated fat. Roquefort has a higher glycemic index. The glycemic index of roquefort is 27, while the glycemic index of tarragon is 0. Specific food types used in this comparison are Spices, tarragon, dried and Cheese, roquefort .
Infographic
Mineral Comparison
Mineral comparison score is based on the number of minerals by which one or the other food is richer. The "coverage" charts below show how much of the daily needs can be covered by 300 grams of the food.
8
100 g
300 g
0.25 tsp - 0.5g 1 tsp, ground - 1.6g 1 tbsp, leaves - 1.8g 1 tbsp, ground - 4.8g
Magnesium
Magnesium
Calcium
Calcium
Potassium
Potassium
Iron
Iron
Copper
Copper
Zinc
Zinc
Phosphorus
Phosphorus
Sodium
Sodium
Manganese
Manganese
Selenium
Selenium
248%
342%
266%
1211%
226%
106%
134%
8.1%
1039%
24%
2
100 g
300 g
1 oz - 28.35g 1 package (3 oz) - 85g
Magnesium
Magnesium
Calcium
Calcium
Potassium
Potassium
Iron
Iron
Copper
Copper
Zinc
Zinc
Phosphorus
Phosphorus
Sodium
Sodium
Manganese
Manganese
Selenium
Selenium
21%
199%
8%
21%
11%
57%
168%
236%
3.9%
79%
Vitamin Comparison
Vitamin comparison score is based on the number of vitamins by which one or the other food is richer. The "coverage" charts below show how much of the daily needs can be covered by 300 grams of the food.
6
100 g
300 g
0.25 tsp - 0.5g 1 tsp, ground - 1.6g 1 tbsp, leaves - 1.8g 1 tbsp, ground - 4.8g
Vitamin C
Vit. C
Vitamin D
Vit. D
Vitamin A
Vit. A
Vitamin E
Vit. E
Vitamin B1
Vit. B1
Vitamin B2
Vit. B2
Vitamin B3
Vit. B3
Vitamin B5
Vit. B5
Vitamin B6
Vit. B6
Vitamin B12
Vit. B12
Vitamin K
Vit. K
Folate
Folate
167%
0%
70%
0%
63%
309%
168%
0%
556%
0%
0%
206%
3
100 g
300 g
1 oz - 28.35g 1 package (3 oz) - 85g
Vitamin C
Vit. C
Vitamin D
Vit. D
Vitamin A
Vit. A
Vitamin E
Vit. E
Vitamin B1
Vit. B1
Vitamin B2
Vit. B2
Vitamin B3
Vit. B3
Vitamin B5
Vit. B5
Vitamin B6
Vit. B6
Vitamin B12
Vit. B12
Vitamin K
Vit. K
Folate
Folate
0%
0%
98%
0%
10%
135%
14%
104%
29%
80%
0%
37%
All nutrients comparison - raw data values
Nutrient
DV% diff.
Iron
32.3mg
0.56mg
397%
Manganese
7.967mg
0.03mg
345%
Vitamin B6
2.41mg
0.124mg
176%
Potassium
3020mg
91mg
86%
Saturated fat
1.881g
19.263g
79%
Sodium
62mg
1809mg
76%
Magnesium
347mg
30mg
75%
Copper
0.677mg
0.034mg
71%
Vitamin B2
1.339mg
0.586mg
58%
Vitamin C
50mg
0mg
56%
Folate
274µg
49µg
56%
Vitamin B3
8.95mg
0.734mg
51%
Calcium
1139mg
662mg
48%
Fats
7.24g
30.64g
36%
Vitamin B5
1.731mg
35%
Cholesterol
0mg
90mg
30%
Fiber
7.4g
0g
30%
Vitamin B12
0µg
0.64µg
27%
Monounsaturated fat
0.474g
8.474g
20%
Selenium
4.4µg
14.5µg
18%
Vitamin B1
0.251mg
0.04mg
18%
Zinc
3.9mg
2.08mg
17%
Carbs
50.22g
2g
16%
Polyunsaturated fat
3.698g
1.32g
16%
Phosphorus
313mg
392mg
11%
Vitamin A
210µg
294µg
9%
Calories
295kcal
369kcal
4%
Protein
22.77g
21.54g
2%
Protein per 100 calories
7.7g
5.8g
N/A
Calories per 10 g protein
130kcal
171kcal
N/A
Weight per 100 calories
34g
27g
N/A
Unsaturated / Saturated Fat ratio
2.2
0.51
N/A
Net carbs
42.82g
2g
N/A
Tryptophan
0.303mg
0%
Threonine
0.965mg
0%
Isoleucine
1.217mg
0%
Leucine
2.114mg
0%
Lysine
1.848mg
0%
Methionine
0.558mg
0%
Phenylalanine
1.023mg
0%
Valine
1.614mg
0%
Histidine
0.602mg
0%
Macronutrient Comparison
Macronutrient breakdown side-by-side comparison
3
23%
7%
50%
8%
12%
Protein:
22.77 g
Fats:
7.24 g
Carbs:
50.22 g
Water:
7.74 g
Other:
12.03 g
2
22%
31%
2%
39%
6%
Protein:
21.54 g
Fats:
30.64 g
Carbs:
2 g
Water:
39.38 g
Other:
6.44 g
Contains
more
Carbs Carbs
+2411%
Contains
more
Other Other
+86.8%
Contains
more
Fats Fats
+323.2%
Contains
more
Water Water
+408.8%
~equal in
Protein
~21.54g
Fat Type Comparison
Fat type breakdown side-by-side comparison
2
31%
8%
61%
Saturated fat:
Sat. Fat
1.881 g
Monounsaturated fat:
Mono. Fat
0.474 g
Polyunsaturated fat:
Poly. Fat
3.698 g
1
66%
29%
5%
Saturated fat:
Sat. Fat
19.263 g
Monounsaturated fat:
Mono. Fat
8.474 g
Polyunsaturated fat:
Poly. Fat
1.32 g
Contains
less
Sat. Fat Saturated fat
-90.2%
Contains
more
Poly. Fat Polyunsaturated fat
+180.2%
Contains
more
Mono. Fat Monounsaturated fat
+1687.8%