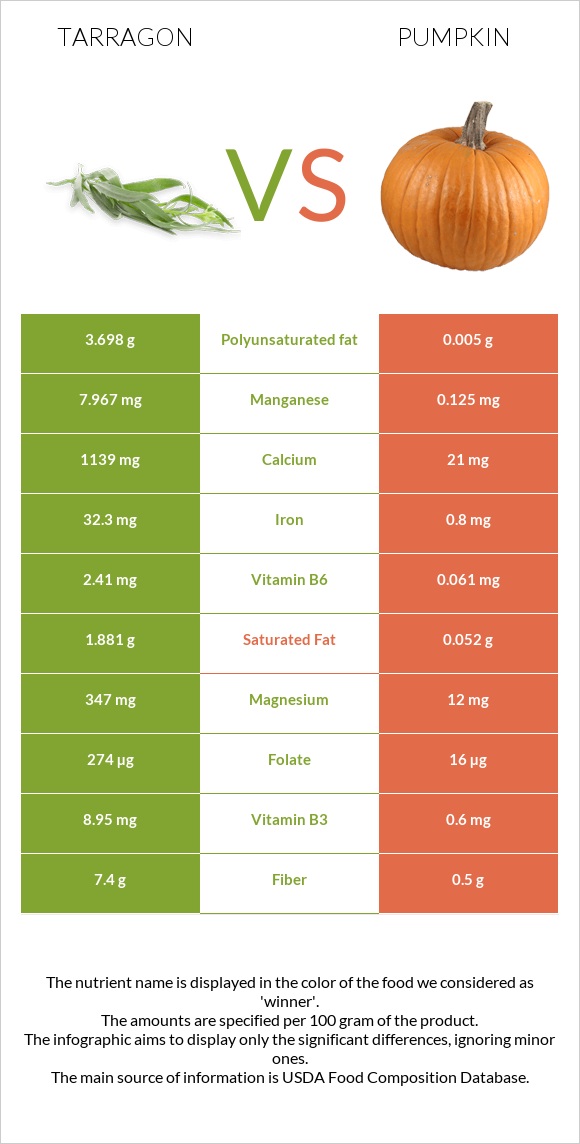
The main differences between tarragon and pumpkins Pumpkins contain less iron, manganese, vitamin B6, calcium, vitamin B2, potassium, magnesium, folate, copper, and vitamin B3 than tarragon. Daily need coverage for iron for tarragon is 397% higher. Pumpkins have 90 times less manganese than tarragon. Tarragon has 7.967mg of manganese, while pumpkins have 0.089mg. Pumpkins have a higher glycemic index than tarragon. Food types used in this article are Spices, tarragon, dried and Pumpkin, cooked, boiled, drained, without salt .
Infographic
Mineral Comparison
Mineral comparison score is based on the number of minerals by which one or the other food is richer. The "coverage" charts below show how much of the daily needs can be covered by 300 grams of the food.
9
100 g
300 g
0.25 tsp - 0.5g 1 tsp, ground - 1.6g 1 tbsp, leaves - 1.8g 1 tbsp, ground - 4.8g
Magnesium
Magnesium
Calcium
Calcium
Potassium
Potassium
Iron
Iron
Copper
Copper
Zinc
Zinc
Phosphorus
Phosphorus
Sodium
Sodium
Manganese
Manganese
Selenium
Selenium
248%
342%
266%
1211%
226%
106%
134%
8.1%
1039%
24%
1
100 g
300 g
1 cup, mashed - 245g
Magnesium
Magnesium
Calcium
Calcium
Potassium
Potassium
Iron
Iron
Copper
Copper
Zinc
Zinc
Phosphorus
Phosphorus
Sodium
Sodium
Manganese
Manganese
Selenium
Selenium
6.4%
4.5%
20%
21%
30%
6.3%
13%
0.13%
12%
1.1%
Vitamin Comparison
Vitamin comparison score is based on the number of vitamins by which one or the other food is richer. The "coverage" charts below show how much of the daily needs can be covered by 300 grams of the food.
6
100 g
300 g
0.25 tsp - 0.5g 1 tsp, ground - 1.6g 1 tbsp, leaves - 1.8g 1 tbsp, ground - 4.8g
Vitamin C
Vit. C
Vitamin D
Vit. D
Vitamin A
Vit. A
Vitamin E
Vit. E
Vitamin B1
Vit. B1
Vitamin B2
Vit. B2
Vitamin B3
Vit. B3
Vitamin B5
Vit. B5
Vitamin B6
Vit. B6
Vitamin B12
Vit. B12
Vitamin K
Vit. K
Folate
Folate
167%
0%
70%
0%
63%
309%
168%
0%
556%
0%
0%
206%
4
100 g
300 g
1 cup, mashed - 245g
Vitamin C
Vit. C
Vitamin D
Vit. D
Vitamin A
Vit. A
Vitamin E
Vit. E
Vitamin B1
Vit. B1
Vitamin B2
Vit. B2
Vitamin B3
Vit. B3
Vitamin B5
Vit. B5
Vitamin B6
Vit. B6
Vitamin B12
Vit. B12
Vitamin K
Vit. K
Folate
Folate
16%
0%
96%
16%
7.8%
18%
7.7%
12%
10%
0%
2%
6.8%
All nutrients comparison - raw data values
Nutrient
DV% diff.
Iron
32.3mg
0.57mg
397%
Manganese
7.967mg
0.089mg
343%
Vitamin B6
2.41mg
0.044mg
182%
Calcium
1139mg
15mg
112%
Vitamin B2
1.339mg
0.078mg
97%
Potassium
3020mg
230mg
82%
Magnesium
347mg
9mg
80%
Folate
274µg
9µg
66%
Copper
0.677mg
0.091mg
65%
Vitamin B3
8.95mg
0.413mg
53%
Vitamin C
50mg
4.7mg
50%
Protein
22.77g
0.72g
44%
Phosphorus
313mg
30mg
40%
Zinc
3.9mg
0.23mg
33%
Fiber
7.4g
1.1g
25%
Polyunsaturated fat
3.698g
0.004g
25%
Vitamin B1
0.251mg
0.031mg
18%
Carbs
50.22g
4.9g
15%
Calories
295kcal
20kcal
14%
Fats
7.24g
0.07g
11%
Vitamin A
210µg
288µg
9%
Selenium
4.4µg
0.2µg
8%
Saturated fat
1.881g
0.037g
8%
Vitamin E
0.8mg
5%
Vitamin B5
0.201mg
4%
Sodium
62mg
1mg
3%
Vitamin K
0.8µg
1%
Choline
6.2mg
1%
Monounsaturated fat
0.474g
0.009g
1%
Protein per 100 calories
7.7g
3.6g
N/A
Calories per 10 g protein
130kcal
278kcal
N/A
Weight per 100 calories
34g
500g
N/A
Unsaturated / Saturated Fat ratio
2.2
0.35
N/A
Net carbs
42.82g
3.8g
N/A
Sugar
2.08g
N/A
Tryptophan
0.009mg
0%
Threonine
0.021mg
0%
Isoleucine
0.023mg
0%
Leucine
0.034mg
0%
Lysine
0.039mg
0%
Methionine
0.008mg
0%
Phenylalanine
0.023mg
0%
Valine
0.025mg
0%
Histidine
0.011mg
0%
Macronutrient Comparison
Macronutrient breakdown side-by-side comparison
4
23%
7%
50%
8%
12%
Protein:
22.77 g
Fats:
7.24 g
Carbs:
50.22 g
Water:
7.74 g
Other:
12.03 g
1
5%
94%
Protein:
0.72 g
Fats:
0.07 g
Carbs:
4.9 g
Water:
93.69 g
Other:
0.62 g
Contains
more
Protein Protein
+3062.5%
Contains
more
Fats Fats
+10242.9%
Contains
more
Carbs Carbs
+924.9%
Contains
more
Other Other
+1840.3%
Contains
more
Water Water
+1110.5%
Fat Type Comparison
Fat type breakdown side-by-side comparison
2
31%
8%
61%
Saturated fat:
Sat. Fat
1.881 g
Monounsaturated fat:
Mono. Fat
0.474 g
Polyunsaturated fat:
Poly. Fat
3.698 g
1
74%
18%
8%
Saturated fat:
Sat. Fat
0.037 g
Monounsaturated fat:
Mono. Fat
0.009 g
Polyunsaturated fat:
Poly. Fat
0.004 g
Contains
more
Mono. Fat Monounsaturated fat
+5166.7%
Contains
more
Poly. Fat Polyunsaturated fat
+92350%
Contains
less
Sat. Fat Saturated fat
-98%