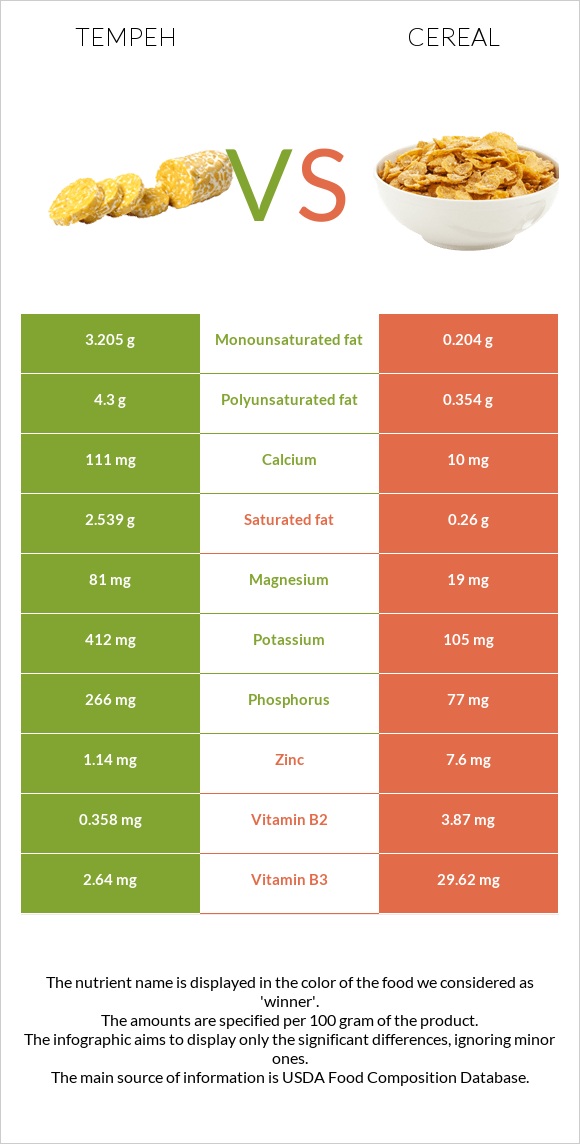
Important differences between tempeh and cereal Tempeh has more copper; however, cereal has more vitamin B1, vitamin B6, iron, vitamin B2, vitamin B3, zinc, vitamin A, and vitamin C. Cereal's daily need coverage for vitamin B1 is 518% more. Tempeh has 4 times more copper than cereal. Tempeh has 0.56mg of copper, while cereal has 0.137mg. Tempeh is lower in sodium. Cereal has a higher glycemic index than tempeh. The food varieties used in the comparison are Tempeh and Cereals ready-to-eat, USDA Commodity Corn and Rice (includes all commodity brands) .
Infographic
Mineral Comparison
Mineral comparison score is based on the number of minerals by which one or the other food is richer. The "coverage" charts below show how much of the daily needs can be covered by 300 grams of the food.
7
100 g
300 g
1 cup - 166g
Magnesium
Magnesium
Calcium
Calcium
Potassium
Potassium
Iron
Iron
Copper
Copper
Zinc
Zinc
Phosphorus
Phosphorus
Sodium
Sodium
Manganese
Manganese
Selenium
Selenium
58%
33%
36%
101%
187%
31%
114%
1.2%
170%
0%
3
100 g
300 g
1 cup - 29g 1 serving (NLEA serving = 1 cup) - 29g
Magnesium
Magnesium
Calcium
Calcium
Potassium
Potassium
Iron
Iron
Copper
Copper
Zinc
Zinc
Phosphorus
Phosphorus
Sodium
Sodium
Manganese
Manganese
Selenium
Selenium
14%
3%
9.3%
1277%
46%
207%
33%
104%
103%
34%
Vitamin Comparison
Vitamin comparison score is based on the number of vitamins by which one or the other food is richer. The "coverage" charts below show how much of the daily needs can be covered by 300 grams of the food.
3
100 g
300 g
1 cup - 166g
Vitamin C
Vit. C
Vitamin D
Vit. D
Vitamin A
Vit. A
Vitamin E
Vit. E
Vitamin B1
Vit. B1
Vitamin B2
Vit. B2
Vitamin B3
Vit. B3
Vitamin B5
Vit. B5
Vitamin B6
Vit. B6
Vitamin B12
Vit. B12
Vitamin K
Vit. K
Folate
Folate
0%
0%
0%
0%
20%
83%
50%
17%
50%
10%
0%
18%
7
100 g
300 g
1 cup - 29g 1 serving (NLEA serving = 1 cup) - 29g
Vitamin C
Vit. C
Vitamin D
Vit. D
Vitamin A
Vit. A
Vitamin E
Vit. E
Vitamin B1
Vit. B1
Vitamin B2
Vit. B2
Vitamin B3
Vit. B3
Vitamin B5
Vit. B5
Vitamin B6
Vit. B6
Vitamin B12
Vit. B12
Vitamin K
Vit. K
Folate
Folate
128%
0%
271%
1.6%
1572%
893%
555%
14%
1381%
0%
0%
0%
All nutrients comparison - raw data values
Nutrient
DV% diff.
Vitamin B1
0.078mg
6.288mg
518%
Vitamin B6
0.215mg
5.986mg
444%
Iron
2.7mg
34.06mg
392%
Vitamin B2
0.358mg
3.87mg
270%
Vitamin B3
2.64mg
29.62mg
169%
Vitamin A
0µg
814µg
90%
Zinc
1.14mg
7.6mg
59%
Copper
0.56mg
0.137mg
47%
Vitamin C
0mg
38.5mg
43%
Sodium
9mg
795mg
34%
Protein
20.29g
6.06g
28%
Phosphorus
266mg
77mg
27%
Carbs
7.64g
86.85g
26%
Polyunsaturated fat
4.3g
0.354g
26%
Manganese
1.3mg
0.79mg
22%
Fats
10.8g
1.08g
15%
Magnesium
81mg
19mg
15%
Selenium
0µg
6.3µg
11%
Calcium
111mg
10mg
10%
Saturated fat
2.539g
0.26g
10%
Calories
192kcal
378kcal
9%
Potassium
412mg
105mg
9%
Monounsaturated fat
3.205g
0.204g
8%
Fiber
1.4g
6%
Folate
24µg
6%
Vitamin B12
0.08µg
3%
Vitamin E
0.08mg
1%
Vitamin B5
0.278mg
0.226mg
1%
Protein per 100 calories
11g
1.6g
N/A
Calories per 10 g protein
95kcal
624kcal
N/A
Weight per 100 calories
52g
26g
N/A
Unsaturated / Saturated Fat ratio
3
2.1
N/A
Net carbs
7.64g
85.45g
N/A
Sugar
10.35g
N/A
Tryptophan
0.194mg
0.066mg
0%
Threonine
0.796mg
0.241mg
0%
Isoleucine
0.88mg
0.26mg
0%
Leucine
1.43mg
0.767mg
0%
Lysine
0.908mg
0.113mg
0%
Methionine
0.175mg
0.13mg
0%
Phenylalanine
0.893mg
0.365mg
0%
Valine
0.92mg
0.344mg
0%
Histidine
0.466mg
0.162mg
0%
Fructose
0.26g
0%
Macronutrient Comparison
Macronutrient breakdown side-by-side comparison
3
20%
11%
8%
60%
Protein:
20.29 g
Fats:
10.8 g
Carbs:
7.64 g
Water:
59.65 g
Other:
1.62 g
2
6%
87%
4%
2%
Protein:
6.06 g
Fats:
1.08 g
Carbs:
86.85 g
Water:
3.78 g
Other:
2.23 g
Contains
more
Protein Protein
+234.8%
Contains
more
Fats Fats
+900%
Contains
more
Water Water
+1478%
Contains
more
Carbs Carbs
+1036.8%
Contains
more
Other Other
+37.7%
Fat Type Comparison
Fat type breakdown side-by-side comparison
2
25%
32%
43%
Saturated fat:
Sat. Fat
2.539 g
Monounsaturated fat:
Mono. Fat
3.205 g
Polyunsaturated fat:
Poly. Fat
4.3 g
1
32%
25%
43%
Saturated fat:
Sat. Fat
0.26 g
Monounsaturated fat:
Mono. Fat
0.204 g
Polyunsaturated fat:
Poly. Fat
0.354 g
Contains
more
Mono. Fat Monounsaturated fat
+1471.1%
Contains
more
Poly. Fat Polyunsaturated fat
+1114.7%
Contains
less
Sat. Fat Saturated fat
-89.8%