Tilapia vs. Salmon — Health Impact and Nutrition Comparison


Summary
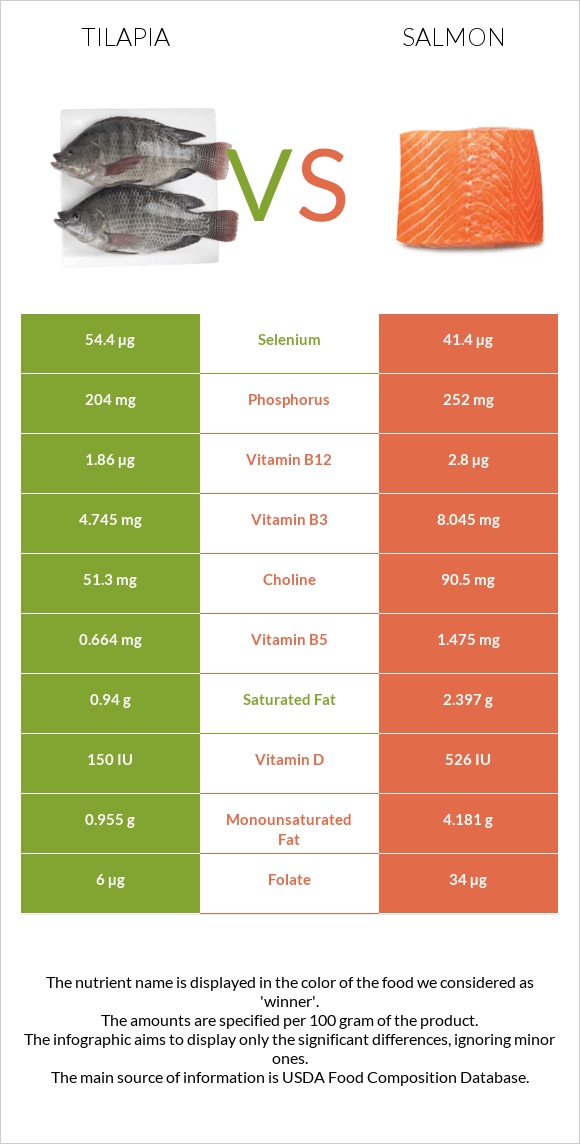
Salmon is a saltwater fish richer in choline, phosphorus, proteins, B complex vitamins, and vitamins A, E, and D. In addition. It is 4.5 times richer in omega-3 fats. In comparison, tilapia is a freshwater fish; it is lower in calories and richer in copper, iron, and selenium.
Introduction
This article is a comparison between salmon and tilapia fish. They are different fish according to their general features, which will be further discussed in the section on the difference in their general aspects.
By the end of the article, we will understand why both fish are considered healthy nutritional sources of different nutrients.
Tilapia is a freshwater fish. In comparison, salmon is a saltwater fish.
We will compare salmon and tilapia to each other based on some general aspects, nutritional contents, and health impacts.
General aspects
In this section, we will discuss some general aspects of their appearance, taste, and flavor.
Appearance
Tilapia is a smaller fish compared to salmon and has white meat. In comparison, salmon is a bigger fish and has orange-salmon-colored meat.
Tilapia fish is an excellent source of fish for filleting.
Taste and flavor
Tilapia fish has a milder flavor compared to salmon. It is often filleted to be fried, baked, or even breaded and deep-fried. In comparison, salmon has a stronger flavor and is more often considered a higher-end fish than tilapia.
Salmon roe or salmon caviar is widely used in the culinary world.
Nutritional content comparison
In this section, we will compare 100g of each fish cooked in dry heat - no oil added.
Calories
Salmon is higher in calories compared to tilapia. Salmon contains nearly 142 calories, whereas tilapia contains 96 calories.
Carbs and Glycemic index
Their carb and glycemic indices are negligible.
Proteins
Salmon is richer in proteins compared to tilapia. Salmon contains 25.4g of proteins and tilapia contains 20g of protein.
Macronutrient Comparison
Contains
more
ProteinProtein
+18.3%
Contains
more
FatsFats
+366%
Contains
more
OtherOther
+∞%
Fats
Salmon is a fattier fish, and tilapia is a leaner fish.
Salmon contains nearly 4.5 times more fats in comparison to tilapia. Salmon is richer in omega-3 fats such as EPA and DHA than tilapia.
Overall, salmon is richer in polyunsaturated and monounsaturated fats.
Fat Type Comparison
Contains
less
Sat. FatSaturated fat
-60.8%
Contains
more
Mono. FatMonounsaturated fat
+337.8%
Contains
more
Poly. FatPolyunsaturated fat
+658.8%
Minerals
Salmon is richer in choline and phosphorus. In comparison, tilapia is richer in copper, iron, and selenium.
Mineral Comparison
Contains
more
MagnesiumMagnesium
+13.3%
Contains
more
IronIron
+102.9%
Contains
more
CopperCopper
+53.1%
Contains
more
ManganeseManganese
+131.3%
Contains
more
SeleniumSelenium
+31.4%
Contains
more
PhosphorusPhosphorus
+23.5%
Vitamins
Salmon has a richer vitamin profile. It is richer in all B complex vitamins such as B1, B2, B3, B5, B6, and B12. it is also richer in vitamins A, E, and D.
In the diagram below, we can visualize their distributions.
Vitamin Comparison
Contains
more
Vitamin KVitamin K
+800%
Contains
more
Vitamin CVitamin C
+∞%
Contains
more
Vitamin AVitamin A
+∞%
Contains
more
Vitamin EVitamin E
+44.3%
Contains
more
Vitamin DVitamin D
+254.1%
Contains
more
Vitamin B1Vitamin B1
+265.6%
Contains
more
Vitamin B2Vitamin B2
+84.9%
Contains
more
Vitamin B3Vitamin B3
+69.5%
Contains
more
Vitamin B5Vitamin B5
+122.1%
Contains
more
Vitamin B6Vitamin B6
+426%
Contains
more
Vitamin B12Vitamin B12
+50.5%
Contains
more
FolateFolate
+466.7%
Health impacts
Omega-3
It is better to include omega-3 fatty acids in our diets. EPA and DHA have been shown to have various benefits. When consumed in large quantities, omega-3 fats lower triglycerides. They also have cardioprotective properties, nervous system maintenance, and lower risks of Alzheimer's and depression. It can even help increase chemotherapeutic drug tolerance during treatment.
Salmon is richer in omega-3 fats and provides all these benefits.
(1)(2)(3)(4)(5)
Wound healing
Although not very significant in nutrition, tilapia collagen extract is useful in wound healing. A fishbone broth might be used in this case. (6)
Cardiovascular health
Salmon is associated with decreased risks of cardiovascular diseases.
There is a decrease in LDL and triglycerides and addition to increased HDL, which overall decreases risks of atherosclerosis and mortality rates from cardiovascular diseases. (7)
Miscellaneous
Both these fish are packed with nutrients, especially minerals and vitamins. They are a necessary addition to a healthy diet since they provide a good source of macro and micronutrients. As we can visualize in their diagrams, we can see that salmon is richer in most nutrients. However, it is important to mention that tilapia is also rich in nutrients.
These fish can be added to various diets, including diets catered for bodybuilding purposes, since they are low in calories and have a high nutritive value.
Nevertheless, if you want to read about trout vs. salmon, check this article which discusses their differences in detail.
References

Infographic
All nutrients comparison - raw data values
| Nutrient | |
|
DV% diff. |
| Vitamin D | 150 IU | 526 IU | 47% |
| Vitamin D | 3.7µg | 13.1µg | 47% |
| Vitamin B6 | 0.123mg | 0.647mg | 40% |
| Vitamin B12 | 1.86µg | 2.8µg | 39% |
| Polyunsaturated fat | 0.6g | 4.553g | 26% |
| Selenium | 54.4µg | 41.4µg | 24% |
| Vitamin B1 | 0.093mg | 0.34mg | 21% |
| Vitamin B3 | 4.745mg | 8.045mg | 21% |
| Vitamin B5 | 0.664mg | 1.475mg | 16% |
| Fats | 2.65g | 12.35g | 15% |
| Protein | 26.15g | 22.1g | 8% |
| Vitamin A | 0µg | 69µg | 8% |
| Monounsaturated fat | 0.955g | 4.181g | 8% |
| Phosphorus | 204mg | 252mg | 7% |
| Folate | 6µg | 34µg | 7% |
| Choline | 51.3mg | 90.5mg | 7% |
| Saturated fat | 0.94g | 2.397g | 7% |
| Vitamin B2 | 0.073mg | 0.135mg | 5% |
| Calories | 128kcal | 206kcal | 4% |
| Vitamin C | 0mg | 3.7mg | 4% |
| Iron | 0.69mg | 0.34mg | 4% |
| Copper | 0.075mg | 0.049mg | 3% |
| Cholesterol | 57mg | 63mg | 2% |
| Vitamin E | 0.79mg | 1.14mg | 2% |
| Magnesium | 34mg | 30mg | 1% |
| Manganese | 0.037mg | 0.016mg | 1% |
| Vitamin K | 0.9µg | 0.1µg | 1% |
| Calcium | 14mg | 15mg | 0% |
| Potassium | 380mg | 384mg | 0% |
| Zinc | 0.41mg | 0.43mg | 0% |
| Sodium | 56mg | 61mg | 0% |
| Tryptophan | 0.265mg | 0.248mg | 0% |
| Threonine | 1.156mg | 0.969mg | 0% |
| Isoleucine | 1.22mg | 1.018mg | 0% |
| Leucine | 2.04mg | 1.796mg | 0% |
| Lysine | 2.315mg | 2.03mg | 0% |
| Methionine | 0.766mg | 0.654mg | 0% |
| Phenylalanine | 1.05mg | 0.863mg | 0% |
| Valine | 1.28mg | 1.139mg | 0% |
| Histidine | 0.585mg | 0.651mg | 0% |
| Omega-3 - EPA | 0.005g | 0.69g | N/A |
| Omega-3 - DHA | 0.13g | 1.457g | N/A |
| Omega-3 - ALA | 0.045g | N/A | |
| Omega-3 - DPA | 0.06g | 0.17g | N/A |
| Omega-6 - Eicosadienoic acid | 0.015g | N/A |
People also compare


References
All the values for which the sources are not specified explicitly are taken from FDA’s Food Central. The exact link to the food presented on this page can be found below.
- Tilapia - https://fdc.nal.usda.gov/fdc-app.html#/food-details/175177/nutrients
- Salmon - https://fdc.nal.usda.gov/fdc-app.html#/food-details/175168/nutrients
All the Daily Values are presented for males aged 31-50, for 2000-calorie diets.