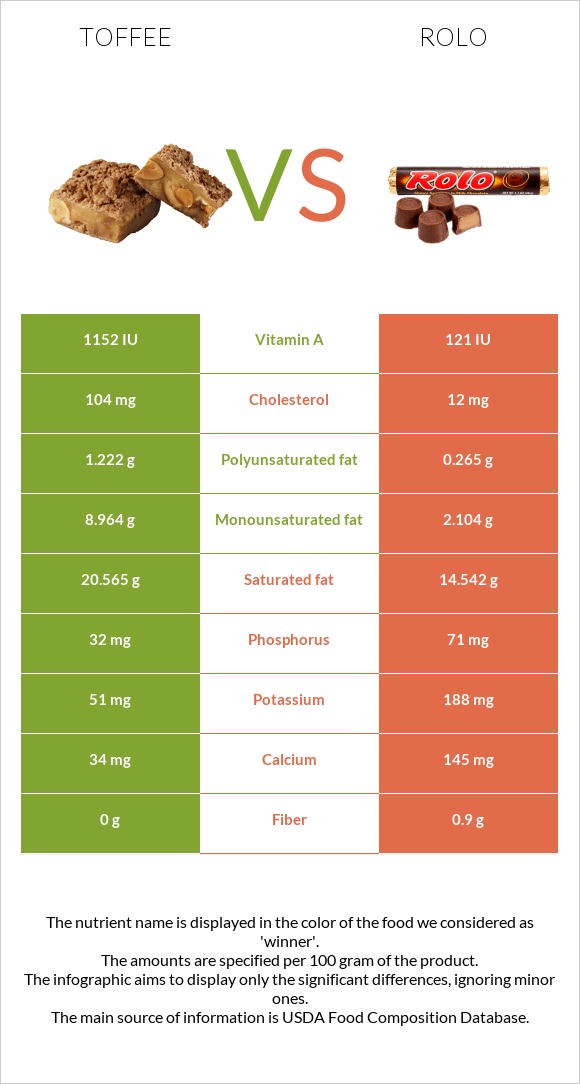
A recap on the differences between toffee and rolo Toffee has more vitamin A, monounsaturated fat, and polyunsaturated fat; however, rolo is higher in calcium, vitamin B12, and phosphorus. Toffee covers your daily cholesterol needs 31% more than rolo. Rolo contains 10 times less vitamin A than toffee. Toffee contains 1152 IU of vitamin A, while rolo contains 121 IU. Rolo has less cholesterol. Food varieties used in this article are Candies, toffee, prepared-from-recipe and Candies, ROLO Caramels in Milk Chocolate .
Infographic
Mineral Comparison
Mineral comparison score is based on the number of minerals by which one or the other food is richer. The "coverage" charts below show how much of the daily needs can be covered by 300 grams of the food.
6
100 g
300 g
1 piece - 12g
Magnesium
Magnesium
Calcium
Calcium
Potassium
Potassium
Iron
Iron
Copper
Copper
Zinc
Zinc
Phosphorus
Phosphorus
Sodium
Sodium
Manganese
Manganese
Selenium
Selenium
2.9%
10%
4.5%
1.1%
1%
3.3%
14%
18%
0.26%
4.4%
4
100 g
300 g
7 pieces - 42g 1 package 1 package - 48g
Magnesium
Magnesium
Calcium
Calcium
Potassium
Potassium
Iron
Iron
Copper
Copper
Zinc
Zinc
Phosphorus
Phosphorus
Sodium
Sodium
Manganese
Manganese
Selenium
Selenium
0%
44%
17%
16%
0%
0%
30%
25%
0%
0%
Vitamin Comparison
Vitamin comparison score is based on the number of vitamins by which one or the other food is richer. The "coverage" charts below show how much of the daily needs can be covered by 300 grams of the food.
4
100 g
300 g
1 piece - 12g
Vitamin C
Vit. C
Vitamin D
Vit. D
Vitamin A
Vit. A
Vitamin E
Vit. E
Vitamin B1
Vit. B1
Vitamin B2
Vit. B2
Vitamin B3
Vit. B3
Vitamin B5
Vit. B5
Vitamin B6
Vit. B6
Vitamin B12
Vit. B12
Vitamin K
Vit. K
Folate
Folate
0.67%
0%
106%
19%
2%
16%
0.54%
8%
2.1%
14%
7%
1.5%
7
100 g
300 g
7 pieces - 42g 1 package 1 package - 48g
Vitamin C
Vit. C
Vitamin D
Vit. D
Vitamin A
Vit. A
Vitamin E
Vit. E
Vitamin B1
Vit. B1
Vitamin B2
Vit. B2
Vitamin B3
Vit. B3
Vitamin B5
Vit. B5
Vitamin B6
Vit. B6
Vitamin B12
Vit. B12
Vitamin K
Vit. K
Folate
Folate
3%
0%
11%
22%
5%
28%
0.75%
0%
0%
41%
8%
0%
All nutrients comparison - raw data values
Nutrient
DV% diff.
Vitamin A
319µg
34µg
32%
Cholesterol
104mg
12mg
31%
Saturated fat
20.565g
14.542g
27%
Fats
32.75g
20.93g
18%
Monounsaturated fat
8.964g
2.104g
17%
Calcium
34mg
145mg
11%
Vitamin B12
0.11µg
0.33µg
9%
Protein
1.07g
5.08g
8%
Phosphorus
32mg
71mg
6%
Polyunsaturated fat
1.222g
0.265g
6%
Iron
0.03mg
0.42mg
5%
Calories
560kcal
474kcal
4%
Potassium
51mg
188mg
4%
Fiber
0g
0.9g
4%
Vitamin B2
0.068mg
0.12mg
4%
Choline
20.1mg
4%
Vitamin B5
0.134mg
0mg
3%
Sodium
135mg
188mg
2%
Caffeine
0mg
6mg
2%
Vitamin C
0.2mg
0.9mg
1%
Carbs
64.72g
67.95g
1%
Magnesium
4mg
0mg
1%
Zinc
0.12mg
0mg
1%
Vitamin E
0.94mg
1.1mg
1%
Selenium
0.8µg
0µg
1%
Vitamin B1
0.008mg
0.02mg
1%
Vitamin B6
0.009mg
0mg
1%
Folate
2µg
0µg
1%
Protein per 100 calories
0.19g
1.1g
N/A
Calories per 10 g protein
5234kcal
933kcal
N/A
Weight per 100 calories
18g
21g
N/A
Unsaturated / Saturated Fat ratio
0.5
0.16
N/A
Net carbs
64.72g
67.05g
N/A
Sugar
63.47g
63.93g
N/A
Copper
0.003mg
0mg
0%
Manganese
0.002mg
0mg
0%
Vitamin B3
0.029mg
0.04mg
0%
Vitamin K
2.8µg
3.2µg
0%
Trans fat
0.674g
0g
N/A
Omega-3 - ALA
0.065g
N/A
Omega-6 - Linoleic acid
0.445g
N/A
Macronutrient Comparison
Macronutrient breakdown side-by-side comparison
1
33%
65%
Protein:
1.07 g
Fats:
32.75 g
Carbs:
64.72 g
Water:
0.55 g
Other:
0.91 g
4
5%
21%
68%
5%
Protein:
5.08 g
Fats:
20.93 g
Carbs:
67.95 g
Water:
4.6 g
Other:
1.44 g
Contains
more
Fats Fats
+56.5%
Contains
more
Protein Protein
+374.8%
Contains
more
Water Water
+736.4%
Contains
more
Other Other
+58.2%
Fat Type Comparison
Fat type breakdown side-by-side comparison
2
67%
29%
4%
Saturated fat:
Sat. Fat
20.565 g
Monounsaturated fat:
Mono. Fat
8.964 g
Polyunsaturated fat:
Poly. Fat
1.222 g
1
86%
12%
Saturated fat:
Sat. Fat
14.542 g
Monounsaturated fat:
Mono. Fat
2.104 g
Polyunsaturated fat:
Poly. Fat
0.265 g
Contains
more
Mono. Fat Monounsaturated fat
+326%
Contains
more
Poly. Fat Polyunsaturated fat
+361.1%
Contains
less
Sat. Fat Saturated fat
-29.3%