Infographic
Mineral Comparison
Mineral comparison score is based on the number of minerals by which one or the other food is richer. The "coverage" charts below show how much of the daily needs can be covered by 300 grams of the food.
3
100 g
300 g
7 pieces - 42g 1 package 1 package - 48g
Magnesium
Magnesium
Calcium
Calcium
Potassium
Potassium
Iron
Iron
Copper
Copper
Zinc
Zinc
Phosphorus
Phosphorus
Sodium
Sodium
Manganese
Manganese
Selenium
Selenium
0%
44%
17%
16%
0%
0%
30%
25%
0%
0%
2
100 g
300 g
1 serving 1.58 oz bag - 45g 1 serving 0.25 cup - 45g 1 serving fun size - 48g
Magnesium
Magnesium
Calcium
Calcium
Potassium
Potassium
Iron
Iron
Copper
Copper
Zinc
Zinc
Phosphorus
Phosphorus
Sodium
Sodium
Manganese
Manganese
Selenium
Selenium
0%
26%
0%
45%
0%
0%
0%
4.3%
0%
0%
Vitamin Comparison
Vitamin comparison score is based on the number of vitamins by which one or the other food is richer. The "coverage" charts below show how much of the daily needs can be covered by 300 grams of the food.
7
100 g
300 g
7 pieces - 42g 1 package 1 package - 48g
Vitamin C
Vit. C
Vitamin D
Vit. D
Vitamin A
Vit. A
Vitamin E
Vit. E
Vitamin B1
Vit. B1
Vitamin B2
Vit. B2
Vitamin B3
Vit. B3
Vitamin B5
Vit. B5
Vitamin B6
Vit. B6
Vitamin B12
Vit. B12
Vitamin K
Vit. K
Folate
Folate
3%
0%
11%
22%
5%
28%
0.75%
0%
0%
41%
8%
0%
1
100 g
300 g
1 serving 1.58 oz bag - 45g 1 serving 0.25 cup - 45g 1 serving fun size - 48g
Vitamin C
Vit. C
Vitamin D
Vit. D
Vitamin A
Vit. A
Vitamin E
Vit. E
Vitamin B1
Vit. B1
Vitamin B2
Vit. B2
Vitamin B3
Vit. B3
Vitamin B5
Vit. B5
Vitamin B6
Vit. B6
Vitamin B12
Vit. B12
Vitamin K
Vit. K
Folate
Folate
5.3%
0%
0%
0%
0%
0%
0%
0%
0%
0%
0%
0%
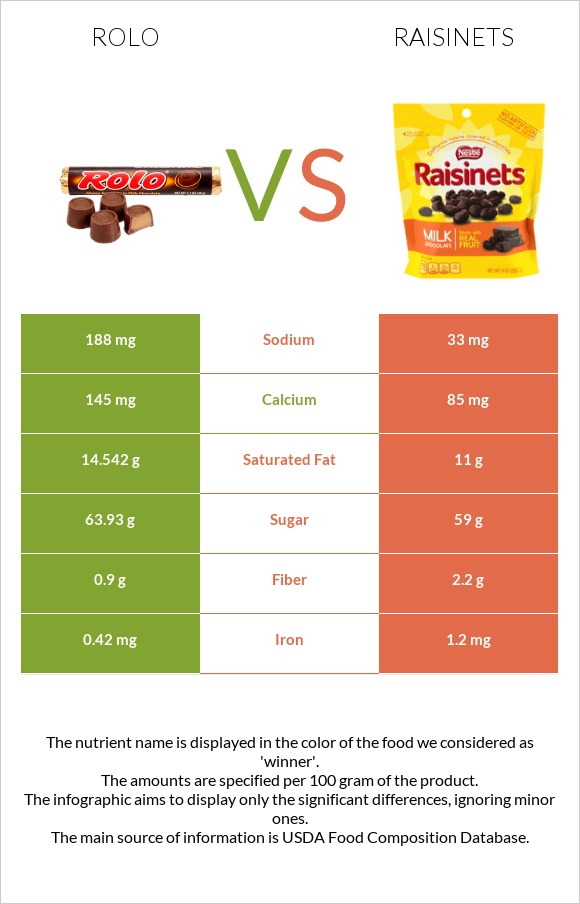
All nutrients comparison - raw data values
Nutrient
DV% diff.
Saturated fat
14.542g
11g
16%
Vitamin B12
0.33µg
14%
Iron
0.42mg
1.2mg
10%
Phosphorus
71mg
10%
Vitamin B2
0.12mg
9%
Sodium
188mg
33mg
7%
Vitamin E
1.1mg
7%
Fats
20.93g
17g
6%
Calcium
145mg
85mg
6%
Potassium
188mg
6%
Fiber
0.9g
2.2g
5%
Monounsaturated fat
2.104g
5%
Vitamin A
34µg
4%
Choline
20.1mg
4%
Calories
474kcal
422kcal
3%
Vitamin K
3.2µg
3%
Vitamin B1
0.02mg
2%
Polyunsaturated fat
0.265g
2%
Caffeine
6mg
2%
Protein
5.08g
4.4g
1%
Vitamin C
0.9mg
1.6mg
1%
Carbs
67.95g
71g
1%
Protein per 100 calories
1.1g
1g
N/A
Calories per 10 g protein
933kcal
959kcal
N/A
Weight per 100 calories
21g
24g
N/A
Unsaturated / Saturated Fat ratio
0.16
0
N/A
Net carbs
67.05g
68.8g
N/A
Cholesterol
12mg
11mg
0%
Sugar
63.93g
59g
N/A
Vitamin B3
0.04mg
0%
Trans fat
0g
0.08g
N/A
Macronutrient Comparison
Macronutrient breakdown side-by-side comparison
3
5%
21%
68%
5%
Protein:
5.08 g
Fats:
20.93 g
Carbs:
67.95 g
Water:
4.6 g
Other:
1.44 g
2
4%
17%
71%
6%
Protein:
4.4 g
Fats:
17 g
Carbs:
71 g
Water:
6.4 g
Other:
1.2 g
Contains
more
Protein Protein
+15.5%
Contains
more
Fats Fats
+23.1%
Contains
more
Other Other
+20%
Contains
more
Water Water
+39.1%
Fat Type Comparison
Fat type breakdown side-by-side comparison
2
86%
12%
Saturated fat:
Sat. Fat
14.542 g
Monounsaturated fat:
Mono. Fat
2.104 g
Polyunsaturated fat:
Poly. Fat
0.265 g
1
100%
Saturated fat:
Sat. Fat
11 g
Monounsaturated fat:
Mono. Fat
0 g
Polyunsaturated fat:
Poly. Fat
0 g
Contains
more
Mono. Fat Monounsaturated fat
+∞%
Contains
more
Poly. Fat Polyunsaturated fat
+∞%
Contains
less
Sat. Fat Saturated fat
-24.4%