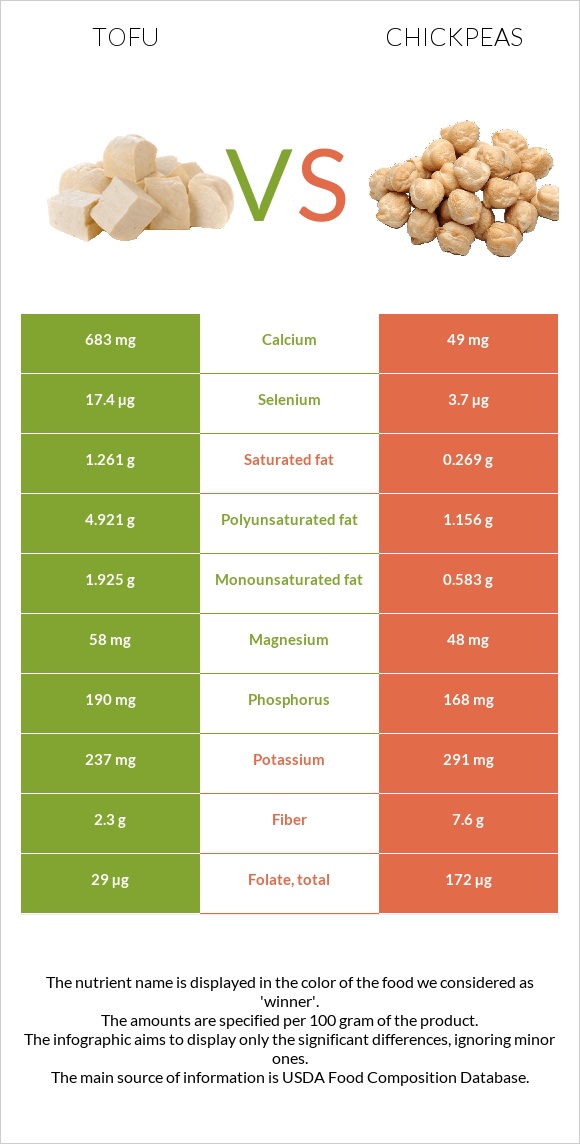
Summary of differences between tofu and chickpeas Tofu has more calcium, selenium, manganese, and monounsaturated fat; however, chickpeas are higher in folate and fiber. Tofu covers your daily need for calcium, 63% more than chickpeas. Tofu has 5 times more selenium than chickpeas. While tofu has 17.4µg of selenium, chickpeas have only 3.7µg. Chickpeas have less saturated fat. The glycemic index of chickpeas is higher. These are the specific foods used in this comparison Tofu, raw, firm, prepared with calcium sulfate and Chickpeas (garbanzo beans, bengal gram), mature seeds, cooked, boiled, without salt .
Infographic
Mineral Comparison
Mineral comparison score is based on the number of minerals by which one or the other food is richer. The "coverage" charts below show how much of the daily needs can be covered by 300 grams of the food.
5
100 g
300 g
0.25 block - 81g 0.5 cup - 126g
Magnesium
Magnesium
Calcium
Calcium
Potassium
Potassium
Iron
Iron
Copper
Copper
Zinc
Zinc
Phosphorus
Phosphorus
Sodium
Sodium
Manganese
Manganese
Selenium
Selenium
41%
205%
21%
100%
126%
43%
81%
1.8%
154%
95%
2
100 g
300 g
1 cup - 164g
Magnesium
Magnesium
Calcium
Calcium
Potassium
Potassium
Iron
Iron
Copper
Copper
Zinc
Zinc
Phosphorus
Phosphorus
Sodium
Sodium
Manganese
Manganese
Selenium
Selenium
34%
15%
26%
108%
117%
42%
72%
0.91%
134%
20%
Vitamin Comparison
Vitamin comparison score is based on the number of vitamins by which one or the other food is richer. The "coverage" charts below show how much of the daily needs can be covered by 300 grams of the food.
2
100 g
300 g
0.25 block - 81g 0.5 cup - 126g
Vitamin C
Vit. C
Vitamin D
Vit. D
Vitamin A
Vit. A
Vitamin E
Vit. E
Vitamin B1
Vit. B1
Vitamin B2
Vit. B2
Vitamin B3
Vit. B3
Vitamin B5
Vit. B5
Vitamin B6
Vit. B6
Vitamin B12
Vit. B12
Vitamin K
Vit. K
Folate
Folate
0.67%
0%
0%
0%
40%
24%
7.1%
8%
21%
0%
0%
22%
8
100 g
300 g
1 cup - 164g
Vitamin C
Vit. C
Vitamin D
Vit. D
Vitamin A
Vit. A
Vitamin E
Vit. E
Vitamin B1
Vit. B1
Vitamin B2
Vit. B2
Vitamin B3
Vit. B3
Vitamin B5
Vit. B5
Vitamin B6
Vit. B6
Vitamin B12
Vit. B12
Vitamin K
Vit. K
Folate
Folate
4.3%
0%
0.33%
7%
29%
15%
9.9%
17%
32%
0%
10%
129%
All nutrients comparison - raw data values
Nutrient
DV% diff.
Calcium
683mg
49mg
63%
Folate
29µg
172µg
36%
Selenium
17.4µg
3.7µg
25%
Polyunsaturated fat
4.921g
1.156g
25%
Fiber
2.3g
7.6g
21%
Protein
17.27g
8.86g
17%
Fats
8.72g
2.59g
9%
Carbs
2.78g
27.42g
8%
Choline
42.8mg
8%
Manganese
1.181mg
1.03mg
7%
Saturated fat
1.261g
0.269g
5%
Vitamin B1
0.158mg
0.116mg
4%
Vitamin B6
0.092mg
0.139mg
4%
Iron
2.66mg
2.89mg
3%
Copper
0.378mg
0.352mg
3%
Phosphorus
190mg
168mg
3%
Vitamin B2
0.102mg
0.063mg
3%
Vitamin B5
0.133mg
0.286mg
3%
Vitamin K
4µg
3%
Monounsaturated fat
1.925g
0.583g
3%
Magnesium
58mg
48mg
2%
Potassium
237mg
291mg
2%
Vitamin E
0.35mg
2%
Calories
144kcal
164kcal
1%
Vitamin C
0.2mg
1.3mg
1%
Vitamin B3
0.381mg
0.526mg
1%
Protein per 100 calories
12g
5.4g
N/A
Calories per 10 g protein
83kcal
185kcal
N/A
Weight per 100 calories
69g
61g
N/A
Unsaturated / Saturated Fat ratio
5.4
6.5
N/A
Net carbs
0.48g
19.82g
N/A
Sugar
4.8g
N/A
Zinc
1.57mg
1.53mg
0%
Sodium
14mg
7mg
0%
Vitamin A
1µg
0%
Tryptophan
0.235mg
0.085mg
0%
Threonine
0.785mg
0.329mg
0%
Isoleucine
0.849mg
0.38mg
0%
Leucine
1.392mg
0.631mg
0%
Lysine
0.883mg
0.593mg
0%
Methionine
0.211mg
0.116mg
0%
Phenylalanine
0.835mg
0.475mg
0%
Valine
0.87mg
0.372mg
0%
Histidine
0.431mg
0.244mg
0%
Macronutrient Comparison
Macronutrient breakdown side-by-side comparison
4
17%
9%
3%
70%
Protein:
17.27 g
Fats:
8.72 g
Carbs:
2.78 g
Water:
69.83 g
Other:
1.4 g
1
9%
3%
27%
60%
Protein:
8.86 g
Fats:
2.59 g
Carbs:
27.42 g
Water:
60.21 g
Other:
0.92 g
Contains
more
Protein Protein
+94.9%
Contains
more
Fats Fats
+236.7%
Contains
more
Water Water
+16%
Contains
more
Other Other
+52.2%
Contains
more
Carbs Carbs
+886.3%
Fat Type Comparison
Fat type breakdown side-by-side comparison
2
16%
24%
61%
Saturated fat:
Sat. Fat
1.261 g
Monounsaturated fat:
Mono. Fat
1.925 g
Polyunsaturated fat:
Poly. Fat
4.921 g
1
13%
29%
58%
Saturated fat:
Sat. Fat
0.269 g
Monounsaturated fat:
Mono. Fat
0.583 g
Polyunsaturated fat:
Poly. Fat
1.156 g
Contains
more
Mono. Fat Monounsaturated fat
+230.2%
Contains
more
Poly. Fat Polyunsaturated fat
+325.7%
Contains
less
Sat. Fat Saturated fat
-78.7%