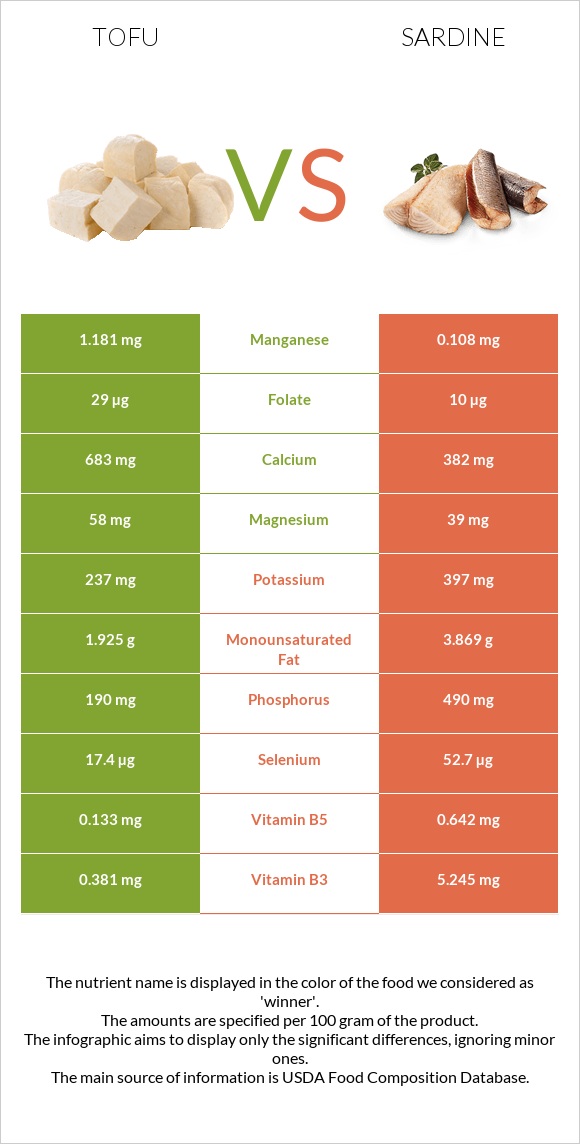
The main differences between tofu and sardines Tofu is richer in manganese, calcium, and copper, yet sardines are richer in vitamin B12, selenium, phosphorus, vitamin B3, and vitamin D*. Daily need coverage for vitamin B12 for sardines is 373% higher. Tofu contains 11 times more manganese than sardines. Tofu contains 1.181mg of manganese, while sardines contain 0.108mg. Tofu contains less sodium. Sardines have a lower glycemic index than tofu. Food types used in this article are Tofu, raw, firm, prepared with calcium sulfate and Fish, sardine, Atlantic, canned in oil, drained solids with bone .
Infographic
Mineral Comparison
Mineral comparison score is based on the number of minerals by which one or the other food is richer. The "coverage" charts below show how much of the daily needs can be covered by 300 grams of the food.
6
100 g
300 g
0.25 block - 81g 0.5 cup - 126g
Magnesium
Magnesium
Calcium
Calcium
Potassium
Potassium
Iron
Iron
Copper
Copper
Zinc
Zinc
Phosphorus
Phosphorus
Sodium
Sodium
Manganese
Manganese
Selenium
Selenium
41%
205%
21%
100%
126%
43%
81%
1.8%
154%
95%
3
100 g
300 g
1 small (2-2/3" x 1/2" x 1/4") - 12g 1 cubic inch - 16g 2 sardines - 24g 1 oz - 28.35g 1 can (3.75 oz) - 92g 1 cup, drained - 149g
Magnesium
Magnesium
Calcium
Calcium
Potassium
Potassium
Iron
Iron
Copper
Copper
Zinc
Zinc
Phosphorus
Phosphorus
Sodium
Sodium
Manganese
Manganese
Selenium
Selenium
28%
115%
35%
110%
62%
36%
210%
40%
14%
287%
Vitamin Comparison
Vitamin comparison score is based on the number of vitamins by which one or the other food is richer. The "coverage" charts below show how much of the daily needs can be covered by 300 grams of the food.
3
100 g
300 g
0.25 block - 81g 0.5 cup - 126g
Vitamin C
Vit. C
Vitamin D
Vit. D
Vitamin A
Vit. A
Vitamin E
Vit. E
Vitamin B1
Vit. B1
Vitamin B2
Vit. B2
Vitamin B3
Vit. B3
Vitamin B5
Vit. B5
Vitamin B6
Vit. B6
Vitamin B12
Vit. B12
Vitamin K
Vit. K
Folate
Folate
0.67%
0%
0%
0%
40%
24%
7.1%
8%
21%
0%
0%
22%
9
100 g
300 g
1 small (2-2/3" x 1/2" x 1/4") - 12g 1 cubic inch - 16g 2 sardines - 24g 1 oz - 28.35g 1 can (3.75 oz) - 92g 1 cup, drained - 149g
Vitamin C
Vit. C
Vitamin D
Vit. D
Vitamin A
Vit. A
Vitamin E
Vit. E
Vitamin B1
Vit. B1
Vitamin B2
Vit. B2
Vitamin B3
Vit. B3
Vitamin B5
Vit. B5
Vitamin B6
Vit. B6
Vitamin B12
Vit. B12
Vitamin K
Vit. K
Folate
Folate
0%
72%
11%
41%
20%
52%
98%
39%
39%
1118%
6.5%
7.5%
All nutrients comparison - raw data values
Nutrient
DV% diff.
Vitamin B12
0µg
8.94µg
373%
Selenium
17.4µg
52.7µg
64%
Cholesterol
0mg
142mg
47%
Manganese
1.181mg
0.108mg
47%
Phosphorus
190mg
490mg
43%
Calcium
683mg
382mg
30%
Vitamin B3
0.381mg
5.245mg
30%
Vitamin D*
0 IU
193 IU
24%
Vitamin D
0µg
4.8µg
24%
Copper
0.378mg
0.186mg
21%
Protein
17.27g
24.62g
15%
Vitamin E
2.04mg
14%
Choline
75mg
14%
Sodium
14mg
307mg
13%
Vitamin B2
0.102mg
0.227mg
10%
Vitamin B5
0.133mg
0.642mg
10%
Fiber
2.3g
0g
9%
Vitamin B1
0.158mg
0.08mg
7%
Vitamin B6
0.092mg
0.167mg
6%
Magnesium
58mg
39mg
5%
Potassium
237mg
397mg
5%
Folate
29µg
10µg
5%
Monounsaturated fat
1.925g
3.869g
5%
Fats
8.72g
11.45g
4%
Vitamin A
32µg
4%
Calories
144kcal
208kcal
3%
Iron
2.66mg
2.92mg
3%
Zinc
1.57mg
1.31mg
2%
Vitamin K
2.6µg
2%
Polyunsaturated fat
4.921g
5.148g
2%
Carbs
2.78g
0g
1%
Saturated fat
1.261g
1.528g
1%
Protein per 100 calories
12g
12g
N/A
Calories per 10 g protein
83kcal
84kcal
N/A
Weight per 100 calories
69g
48g
N/A
Unsaturated / Saturated Fat ratio
5.4
5.9
N/A
Vitamin C
0.2mg
0mg
0%
Net carbs
0.48g
0g
N/A
Tryptophan
0.235mg
0.276mg
0%
Threonine
0.785mg
1.079mg
0%
Isoleucine
0.849mg
1.134mg
0%
Leucine
1.392mg
2.001mg
0%
Lysine
0.883mg
2.26mg
0%
Methionine
0.211mg
0.729mg
0%
Phenylalanine
0.835mg
0.961mg
0%
Valine
0.87mg
1.268mg
0%
Histidine
0.431mg
0.725mg
0%
Omega-3 - EPA
0.473g
N/A
Omega-3 - DHA
0.509g
N/A
Macronutrient Comparison
Macronutrient breakdown side-by-side comparison
2
17%
9%
3%
70%
Protein:
17.27 g
Fats:
8.72 g
Carbs:
2.78 g
Water:
69.83 g
Other:
1.4 g
3
25%
11%
60%
4%
Protein:
24.62 g
Fats:
11.45 g
Carbs:
0 g
Water:
59.61 g
Other:
4.32 g
Contains
more
Carbs Carbs
+∞%
Contains
more
Water Water
+17.1%
Contains
more
Protein Protein
+42.6%
Contains
more
Fats Fats
+31.3%
Contains
more
Other Other
+208.6%
Fat Type Comparison
Fat type breakdown side-by-side comparison
1
16%
24%
61%
Saturated fat:
Sat. Fat
1.261 g
Monounsaturated fat:
Mono. Fat
1.925 g
Polyunsaturated fat:
Poly. Fat
4.921 g
2
14%
37%
49%
Saturated fat:
Sat. Fat
1.528 g
Monounsaturated fat:
Mono. Fat
3.869 g
Polyunsaturated fat:
Poly. Fat
5.148 g
Contains
less
Sat. Fat Saturated fat
-17.5%
Contains
more
Mono. Fat Monounsaturated fat
+101%
~equal in
Polyunsaturated fat
~5.148g